Fig. 6.
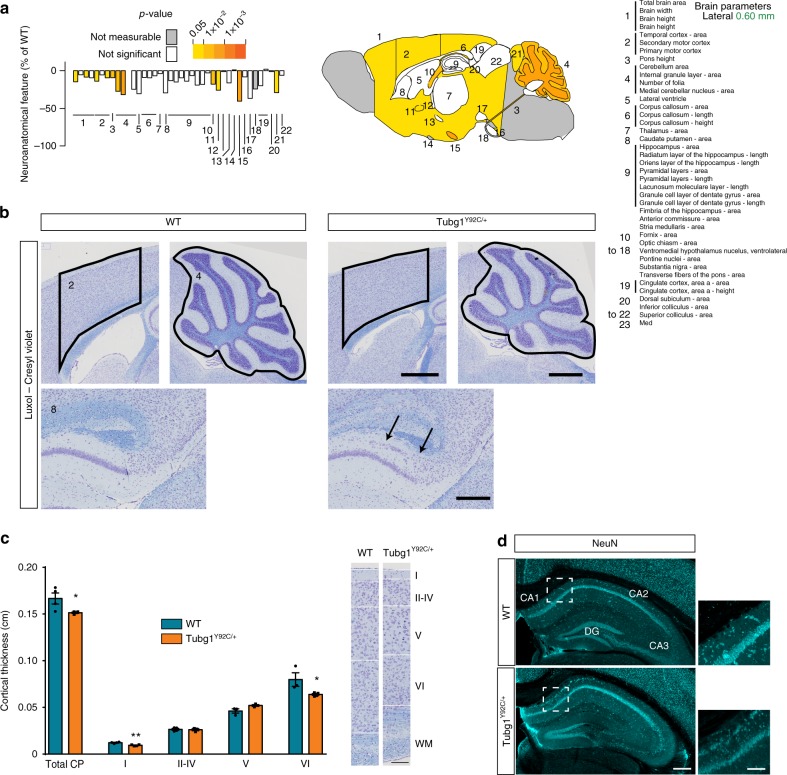
Microcephaly and abnormal hippocampal organization in Tubg1Y92C/+ mice. a Schematic representation of affected brain regions plotted in sagittal planes according to p-values. The right image represents a section at Lateral + 0.60 mm. White coloring indicates a p-value higher than 0.05 and gray shows not enough data to calculate a p-value. Histograms are showing the percentage decrease (minus scale) in size of measured brain regions as compared to the controls (100%). Numbers indicate assessed brain regions listed on the right; n = 4 16-weeks-old male mice per group. b Sagittal sections of the hippocampus, the cortex and the cerebellum from control WT and Tubg1Y92C/+ adult mice stained with cresyl violet/luxol blue. Black arrows indicate the hippocampal heterotopia. Scale bar 0.1 cm (upper panels), 200 µm (lower panel). c Cortical layers analysis (left panel) performed in sections of the secondary motor cortex in control WT and Tubg1Y92C/+ adult mice stained with cresy violet/luxol blue, n = 4 mice per group, unpaired t-test, *p < 0.05, **p < 0.01. Data are presented as mean ± s.e.m. Source data are provided in the Source Data file. Representative images showing layers defects (right panel). Scale bar 150 μm. d Coronal sections of the hippocampus from control WT and Tubg1Y92C/+ adult mice stained with NeuN, scale bar 300 µm. Higher magnification view of the region delimited with dotted square is shown on the right of each image, scale bar 100 µm

