
Fig. 3.
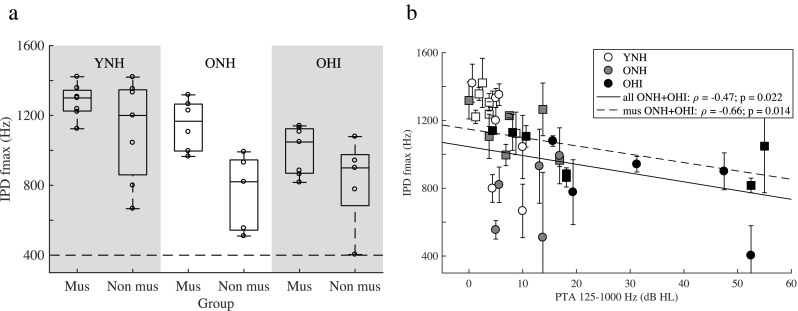
a Highest frequency (fmax) at which an interaural phase difference (IPD) of 180° can be detected for YNH, ONH, and OHI listeners (experiment II). The dashed line indicates the chance performance level. b Scatter plot and Spearman correlation between the IPD fmax and the PTA of the older listeners (solid regression line: ONH and OHI non-musicians; dashed regression line: ONH and OHI musicians). The data of YNH listeners are shown for comparison purpose, but were not included in the correlation. Data for musicians are depicted by square symbols, for non-musicians by circles (open symbols: YNH; gray-filled symbols: ONH; black-filled symbols: OHI)