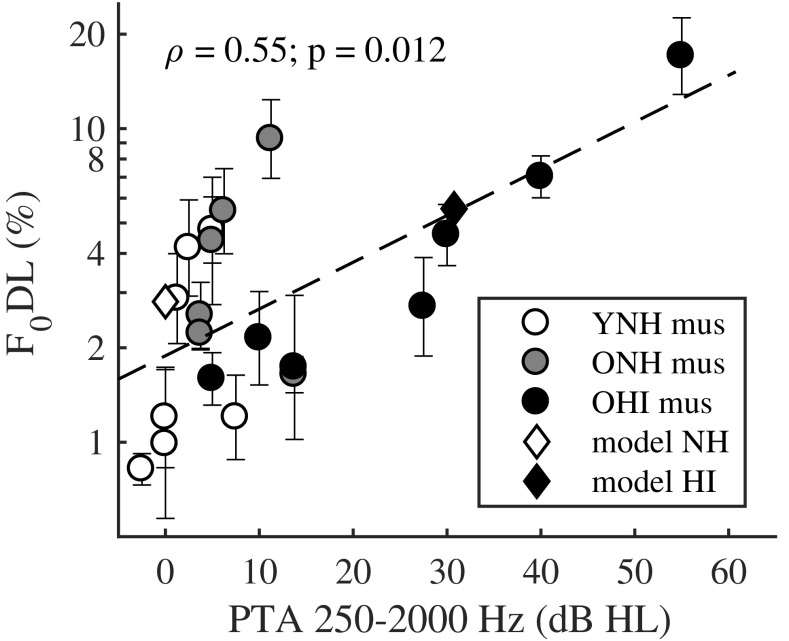
Fig. 6.
Scatter plot and Spearman correlation between the F0DLs for the RES condition, averaged across phase configurations, and the PTA between 250 Hz and 2 kHz of all musicians (open circles: YNH; gray-filled circles: ONH; black circles: OHI). The model predictions for the RES condition, averaged across phase configurations, for NH (PTA = 0 dB HL) and HI listeners (PTA = 31 dB HL), are depicted by the open diamond and filled diamond, respectively

