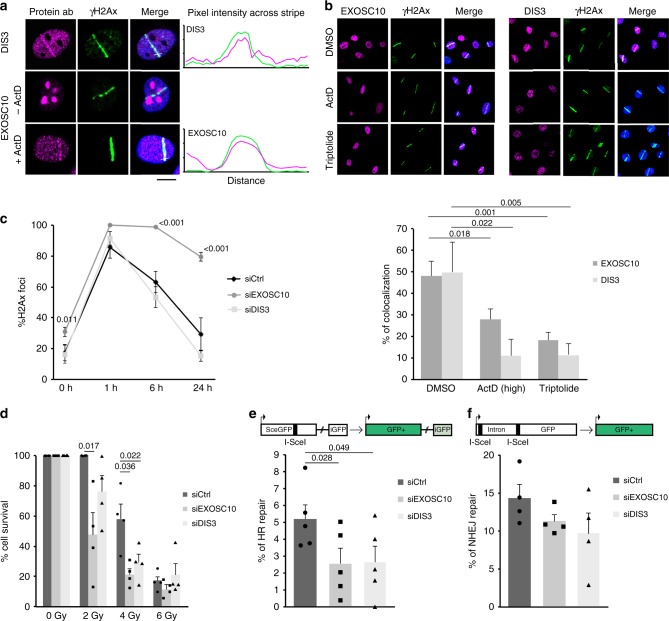
Fig. 1.
The exosome is recruited to DSBs and is necessary for HR. a HeLa cells were co-stained with antibodies against either EXOSC10 or DIS3 and γH2AX 30 min after UV laser micro-irradiation. In some experiments, the cells were treated with Actinomycin D at low concentration (40 nM) for 1 h prior to irradiation and immunostaining to inhibit RNA polymerase I. Scale bar: 10 μm. b UV laser micro-irradiation experiments were carried out as in a, but the cells were treated with either 8 µM Actinomycin D for 1 h or 10 µM Triptolide for 30 min prior to irradiation to inhibit RNAPII. Control cells were treated with DMSO and Actinomycin D (40 nM) to facilitate the imaging of irradiated stripes. The plot shows the percentage of γH2AX-positive stripes co-stained with antibodies against EXOSC10 or DIS3 in each condition. Statistical testing was done using a Mann–Whitney’s test and significant p-values are shown. At least 40 cells were analysed in each condition (from three independent siEXOSC10 experiments and two independent siDIS3 experiments). c Cells were transfected with either siCtrl, siEXOSC10 or siDIS3, irradiated 48 h after transfection with ionizing radiation (5 Gy), and fixed at different time-points. The percentage of cells that showed γH2AX-positive foci were quantified. The statistical significance was tested as in b (n = 3 independent experiments). d Clonogenic assay with 0, 2, 4, and 6 Gy after EXOSC10 and DIS3 knock-down. The histogram shows cell survival 7 days after irradiation. p-values were calculated using a paired student t-test (n = 4). e, f U2OS-DR-GFP or U2OS-EJ5-GFP cells were transfected with either siCtrl, siEXOSC10 or siDIS3 and with a plasmid for I-SceI expression. GFP expression was quantified by flow cytometry and the relative repair efficiencies were calculated. The histograms show the average percentage of GFP-positive cells (% of HR repair in e and % of NHEJ repair in f) (n = 5 and n = 4 independent experiments in e and f, respectively). p-values were calculated using a two-tailed Student’s t-test. Error bars show s.e.m. Source data for Figs. 1b–f are provided as a Source Data file

