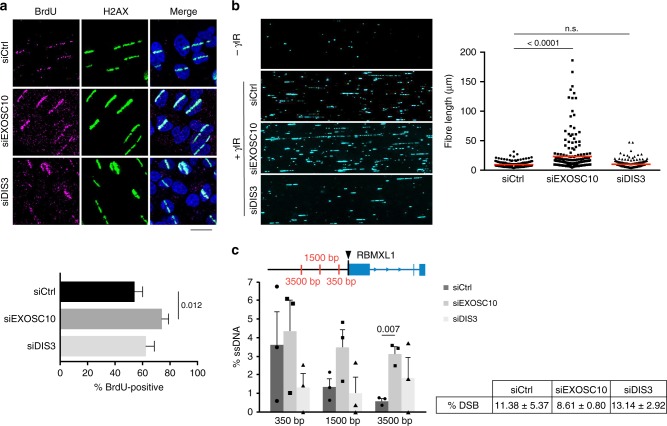
Fig. 3.
EXOSC10 is necessary for limited DNA end resection. a HeLa cells were depleted of either EXOSC10 or DIS3, cultivated in the presence of BrdU for 24 h, UV micro-irradiated and fixed for immunofluorescence 10 min after irradiation. The bar plot shows the percentage of γH2AX-positive stripes that were co-stained by an anti-BrdU antibody. Error bars represent s.e.m. (n > 60 cells for each siRNA treatment, from at least two independent experiments). Statistical testing was done using a Mann–Whitney’s test and significant p-values are shown in the figure. The scale bar represents 20 μm. b The image shows single-strand DNA tracks (SMART) analysed in U2OS cells 48 h after transfection with siCtrl, siEXOSC10 or siDIS3. The graph shows fibre length quantifications of one out of three biological replicates with n = 200 cells analysed. Statistical testing was done using a Mann–Whitney’s test and significant p-values are shown in the figure. c DIvA cells were transfected with either siCtrl, siEXOSC10 or siDIS3 for 48 h and treated with 300 nM 4-OHT for 4 h before extracting the genomic DNA for analysis of DNA end resection. ssDNA levels were measured by qPCR at three positions upstream of the AsiSI cleavage site (arrowhead). The non-DSB background levels were subtracted and the corrected ssDNA values are shown in the histogram. The error bars represent s.e.m. from three independent experiments. Statistical testing was done using a paired Student’s t-test (n = 3) and significant p-values are shown in the figure. The percentage of DSBs produced in each condition is shown in the figure. Source data for Fig. 3a–c are provided as a Source Data file

