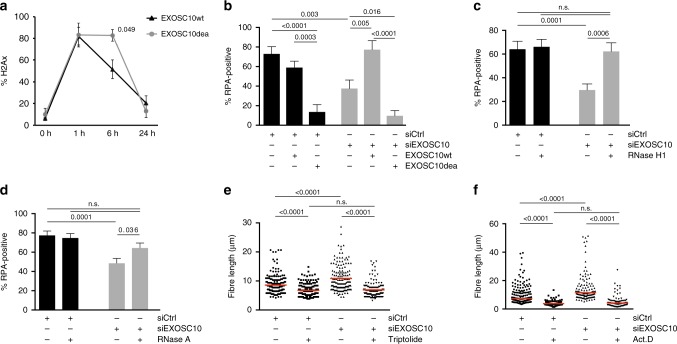
Fig. 6.
DilncRNA degradation is necessary for RPA recruitment. a The EXOSC10 catalytically inactive mutant EXOSC10dea or wild-type EXOSC10 were overexpressed in HeLa cells and γH2AX immunofluorescence was performed at 0, 1, 6, and 24 h after exposing the cells to γ-radiation (5 Gy). The graph shows the percentage of cells with γH2AX foci (n = 150 cells analysed at each time point, from three different experiments). b HeLa cells were transfected with either siCtrl or siEXOSC10. A second transfection was carried out 24 h later with plasmids for expression of EXOSC10wt or EXOSC10dea, as indicated. The cells were micro-irradiated with a 365 nm UV laser 24 h after the second transfection and the recruitment of RPA to the laser stripes was analysed as in Fig. 2b (n > 20 cells for each condition, from three independent experiments). c HeLa cells were transfected with either siCtrl or siEXOSC10. A second transfection was carried out 24 h later with a plasmid for expression of RNase H1 and the recruitment of RPA to laser stripes was analysed (n = 50 cells analysed in each condition, from three independent experiments). d HeLa cells transfected with either siCtrl or siEXOSC10 were micro-irradiated with a 365 nm UV laser, permeabilized with CSKT and treated with or without RNAse A for 30 min at 37 °C. The graph shows the percentage of cells with γH2AX stripes that were co-stained with RPA (n > 80 cells analysed in each condition, from three independent experiments). e, f SMART was done in U2OS cells transfected with either siCtrl or siEXOSC10. The cells were treated with 10 µM Triptolide for 30 min (e) or 8 µM ActD for 1 h (f) before exposure to γ-radiation (10 Gy). The plot shows the measurements of fibre length from one representative experiment (n = 200 analysed fibres). The averages of the median values from three independent experiments are shown in Supplementary Fig. 9. In all cases, the error bars represent s.e.m. and p-values were calculated with Mann–Whitney’s test. Source data for Fig. 6a–f are provided as a Source Data file

