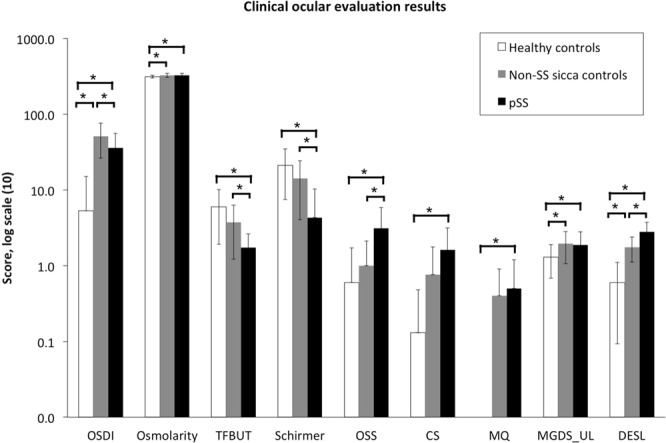
Figure 1.

Ocular examination of the healthy control, non-SS sicca control, and pSS groups. OSDI: Ocular Surface Disease Index questionnaire score; TFBUT: tear film breakup time; OSS: ocular surface staining; CS: corneal staining; MQ: meibum quality; MGDS: meibomian gland dropout score; UL: upper lid; DESL: dry eye severity level. Intergroup difference is significant at *p < 0.05. Results are shown in the log scale, and the exact values of variables are given in the following order: healthy controls, non-SS sicca controls, and pSS. OSDI (5.3; 51.4; 36.2), Osmolarity (313.6; 327.1; 327.8), TFBUT (6.0; 3.8; 1.7), Schirmer’s test (21.2; 14.2; 4.3), OSS (0.6; 1.0; 3.1), CS (0.1; 0.8; 1.6), MQ (0.0; 0.4; 0.5), MGDS_UL (1.3; 2.0; 1.9), DESL (0.6; 1.8; 2.8).
