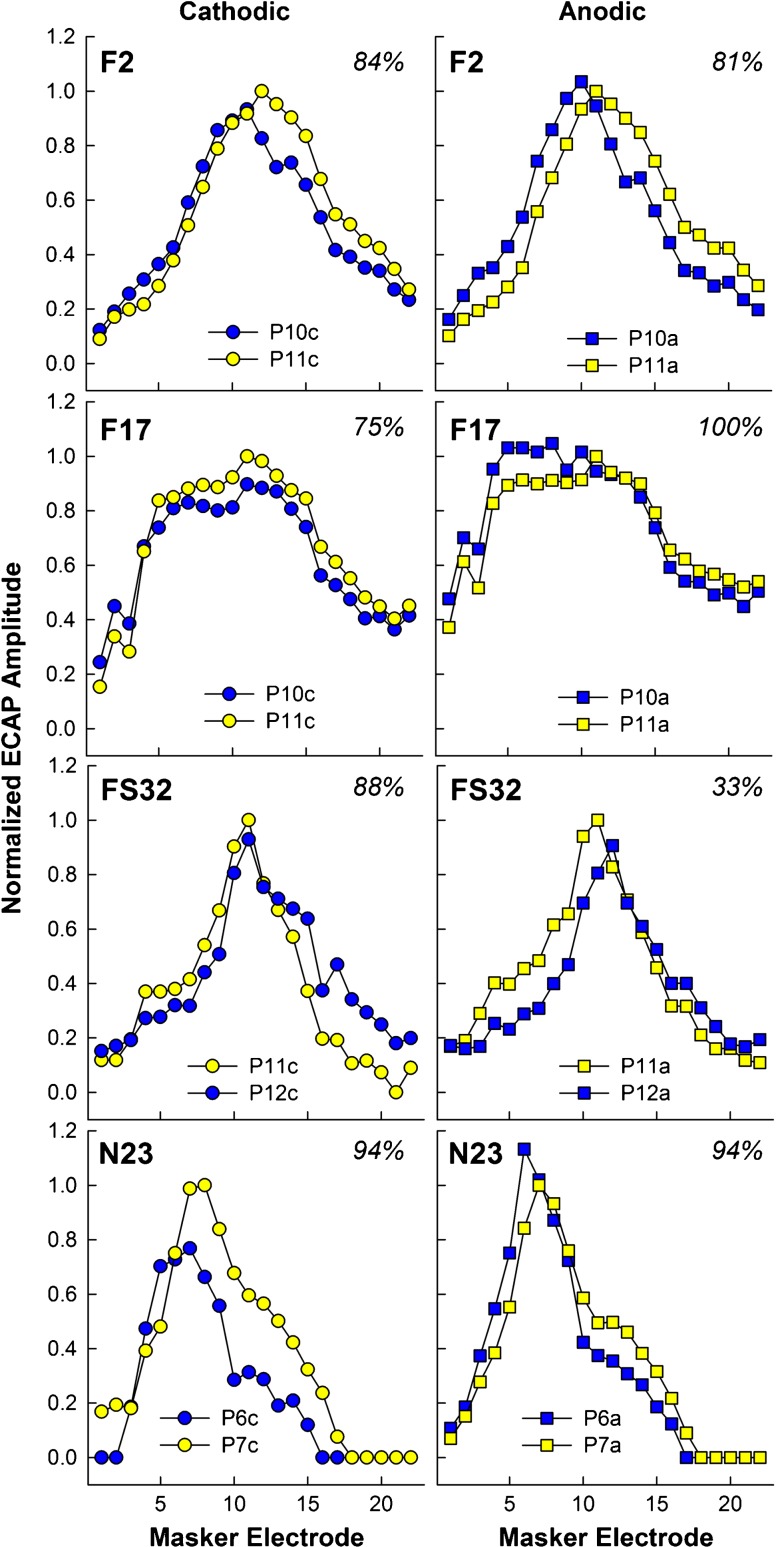
Fig. 2.
Individual examples of the effect of polarity on the spatial separation between ECAP SOE patterns for four participants. Each row depicts data from a different participant. Normalized ECAP amplitude is plotted as a function of masker electrode. Patterns for cathodic-leading probes (circles) are in the left column and for anodic-leading probes (squares) in the right column. The reference probe electrode is shown in yellow symbols and the comparison probe electrode is shown in blue symbols. The specific reference and comparison probe electrodes are shown in the legend of each panel. Participant number and percent correct for pitch ranking are shown at the top of each panel

