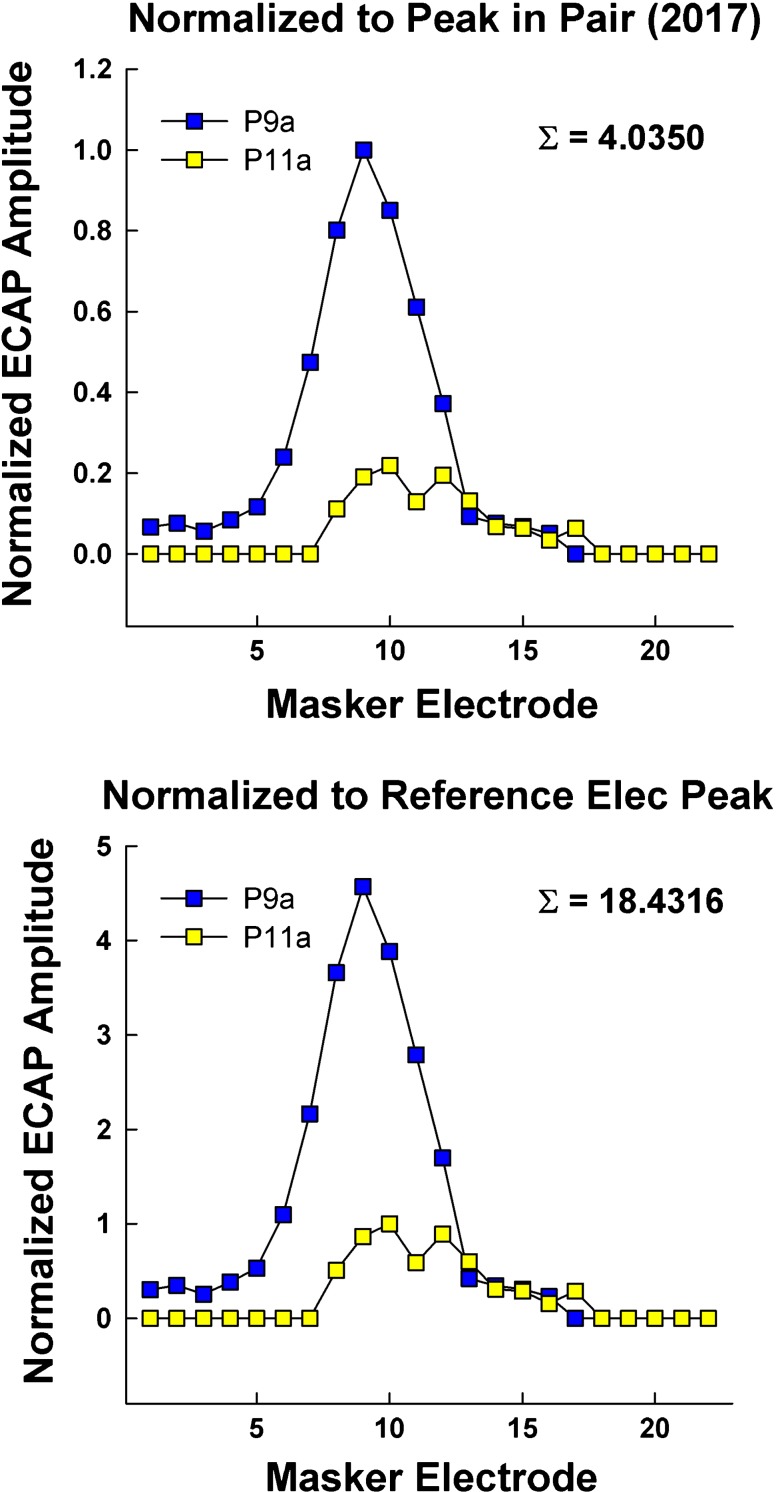
Fig. 6.
Example ECAP SOE patterns for participant F11 depicting the effect of our previous (top panel) and current (bottom panel) normalization procedures. The comparison pair is probe electrodes 9 and 11 in both panels. Data were obtained with anodic-leading biphasic pulses. Top panel: amplitudes were normalized to the largest amplitude within each pair. Bottom panel: amplitudes were normalized to the peak of the SOE function for the reference electrode (probe 11)

