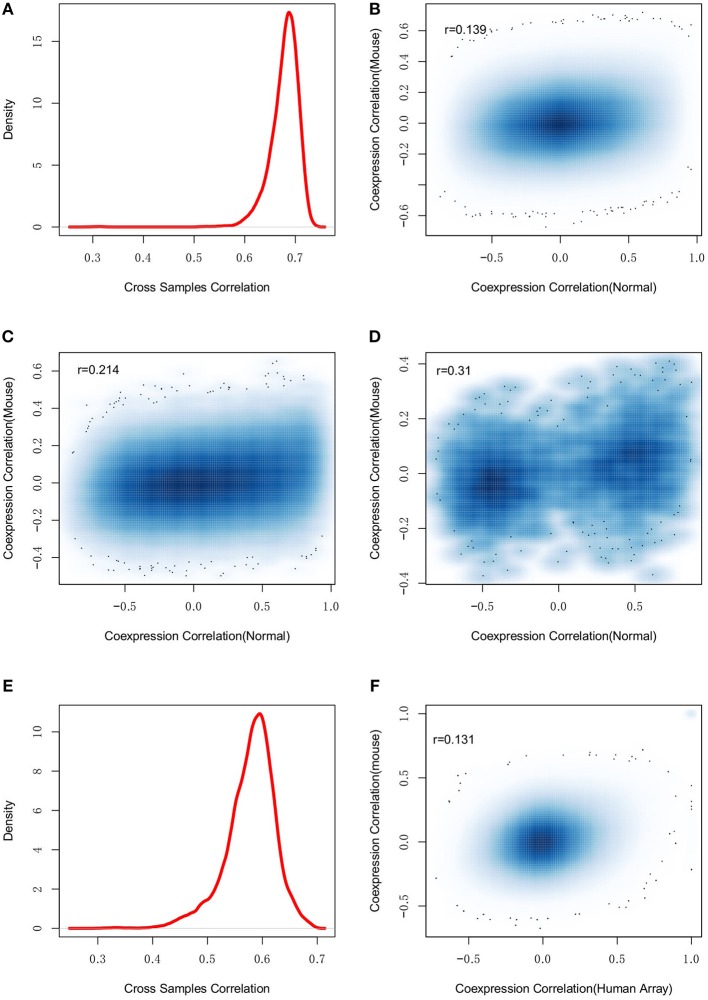
Figure 6.
The dysregulation divergence between human and mouse. (A) shows the density plot of expression profile similarity (correlation) of human and mouse homologous genes, which suggests the conserved gene expression patterns between human and mouse. However, (B) the regulations among all the genomic genes are not conserved between human and mouse (r = 0.139). By restricting the studied regulations to the dysregulated pairs (C) and the edges in Figure 3 (D), the conservation between human and mouse regulations was weakly improved. The observation was further investigated with human microarray data and found good consistent with human RNA-seq (E) but still failed to suggest any gene-gene regulation conservation between human and mouse (F).

