Fig. 4.
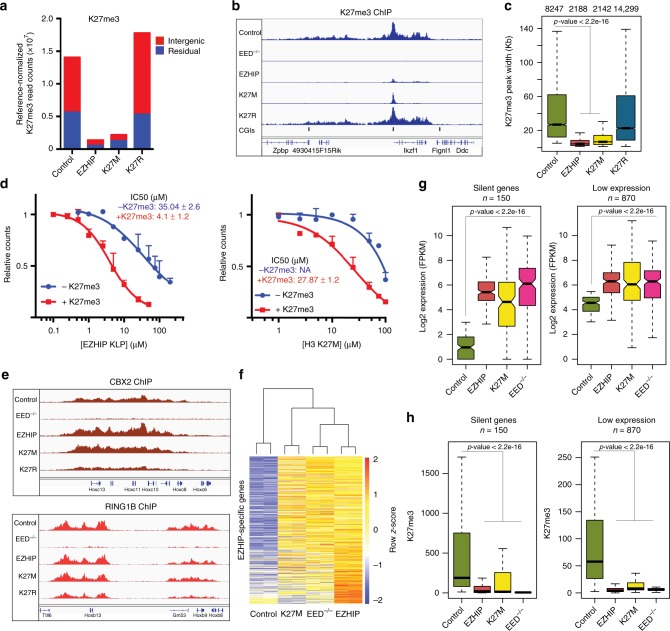
EZHIP leads to global loss of H3K27me3 and a concurrent upregulation of silenced genes. a The number of reference normalized H3K27me3 read densities associated with intergenic or residual H3K27me3 enriched regions are displayed as barplot. b Genome browser representation of reference-normalized H3K27me3 ChIP-Seq profile in mouse embryonic fibroblasts expressing H3K27M, H3K27R, EZHIP, or control cells in a 500 kb region of the genome. Annotations for CpG islands for mm9 genome were downloaded from UCSC table browser. c Boxplot showing the genomic region occupied by H3K27me3 peaks in the indicated samples. n represents the number of H3K27me3 peaks in that sample. d In vitro PRC2 reactions using H3 18–37 peptide in the absence or presence of 20 µM H3K27me3 stimulatory peptide, with increasing concentrations of EZHIP KLP (left) or H3 K27M (right). Variable slope, four parameter Hill curve was fitted to the data to determine IC50 values. Error bars represent the standard deviation. ± represents standard error. e Genome browser representation of RPKM normalized Cbx2 and Ring1b ChIP-Seq profiles from MEFs expressing H3K27M, H3K27R, EZHIP or control cells. f Heatmap displaying the expression pattern of genes upregulated in cells expressing EZHIP. Unguided hierarchical clustering was used to generate dendrogram shown above the heatmap. g Boxplot displaying the expression of silent (left) and low-expression (right) genes. h Boxplot displaying the reference normalized H3K27me3 enrichment at the promoters (5 kb upstream of TSS) of genes displayed in g. p-values were calculated using Wilcoxon rank sum test. Center line in the boxplot represents the median, bottom and top of the box represents 25th and 75th quartiles; whiskers extend to 1.5× interquartile range. n represents the number of genes with posterior probability of differential expression ≥0.95 with log2 expression in parental cells ≤ 3 (silent) or 3 ≤ log2 expression ≤ 5.5 (low expression)

