Fig. 5.
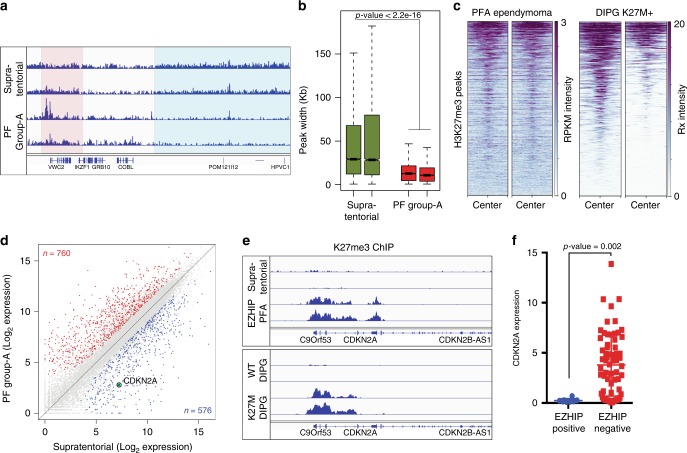
PFA tumors expressing EZHIP display lowered expression of CDKN2A by increasing local H3K27me3. a Genome browser representation of RPKM normalized H3K27me3 ChIP-Seq profile in Posterior Fossa Group-A ependymomas expressing EZHIP and supratentorial ependymomas. Blue and red boxes represent intergenic and residual (retained) H3 K27me3 respectively. b Boxplot displaying the genomic region occupied by H3K27me3 peaks in supratentorial and PFA ependymomas. p-value was determined for the two groups of tumors using Wilcoxon rank sum test. Center line in the boxplot represents the median, bottom and top of the box represents 25th and 75th quartiles; whiskers extend to 1.5× interquartile range. n represents the number of H3K27me3 peaks in that sample. c Heatmap displaying the normalized H3K27me3 enrichment at peaks retained in PFA ependymomas expressing EZHIP in PFA (left) and DIPG cell lines containing H3K27M mutations (right). d Scatter plot displaying the expression of all genes in PFA and supratentorial ependymomas. Red and blue points represent upregulated and downregulated genes in PFA tumors relative to supratentorial tumors. Encircled, green point represents the expression of CDKN2A gene. e Genome browser representation of H3K27me3 ChIP-Seq profile at the CDKN2A locus in PFA and supratentorial tumors (top); and H3.3WT or H3.3K27M DIPG lines (bottom). f Expression of CDKN2A gene in ependymomas with low (blue, n = 7) or high (red, n = 71) expression of EZHIP, as measured by FPKM values. Ependymomas were grouped based on their expression of EZHIP. n represents the number of individual tumor sample within that group. p-value was calculated using non-parametric t-test

