
Fig. 6.
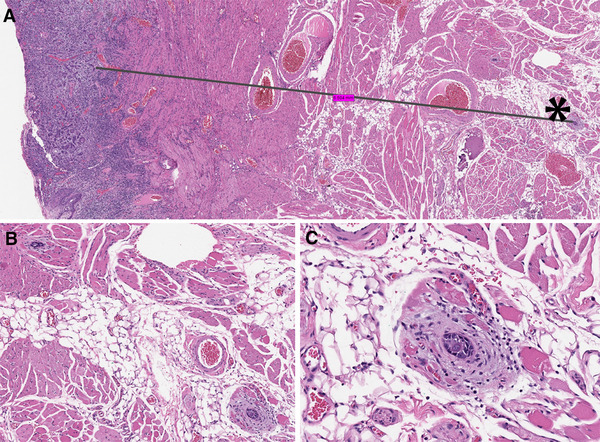
a Two clusters of invasive squamous cell carcinoma (each with about 15 cells, by the black asterisk and in b, c) were 6.5 mm from the bulk of the tumor, suggestive of lymphatic invasion and representing the deepest point of invasion. The black line illustrates the way the distance between the invasive tumor front and remote foci of carcinoma was measured. The pT1 stage was assigned based on the depth of invasion by the bulk of the tumor which was 4.5 mm. b One of the small clusters of carcinoma is in the left upper corner and the second focus of carcinoma is in the right lower corner and in c. Hematoxylin and eosin, images taken from the scanned whole slide image with original magnification of × 1.2