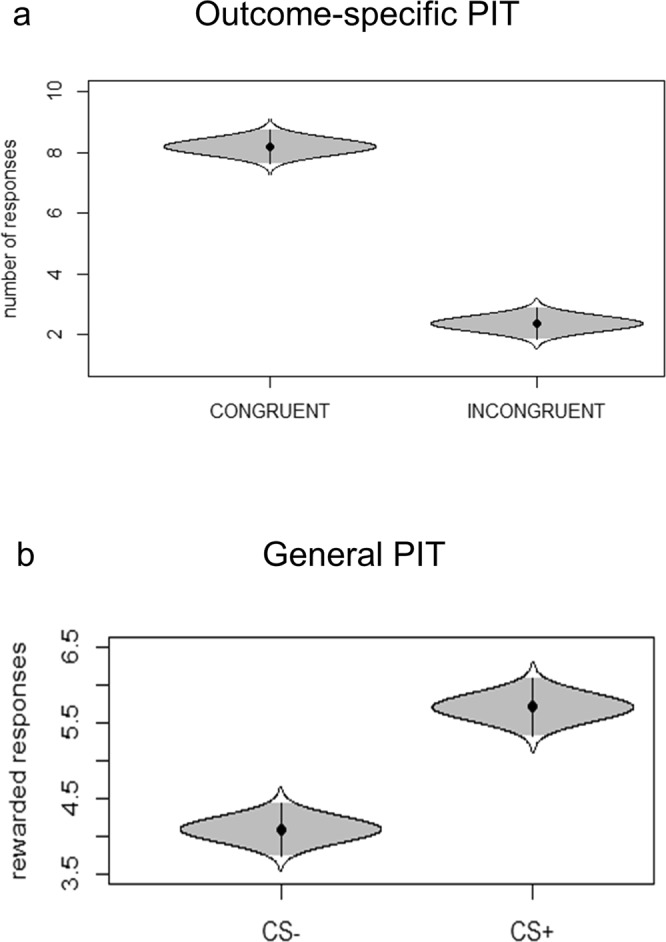
Figure 3.

Cat’s eye plot of the Pavlovian-to-Instrumental Transfer. Panel (a) shows the outcome-specific PIT effect, as represented by a significant difference between the number of congruent (e.g., choosing R+1 when CS+1 is presented) and incongruent responses (e.g., choosing R+2 when CS+1 is presented). Panel (b) shows the general PIT effect, as represented by an increased propensity to choose the reward-associated response (R+) when a reward-associated stimulus is presented (CS+) as compared to the unrewarded stimulus is presented (CS−).
