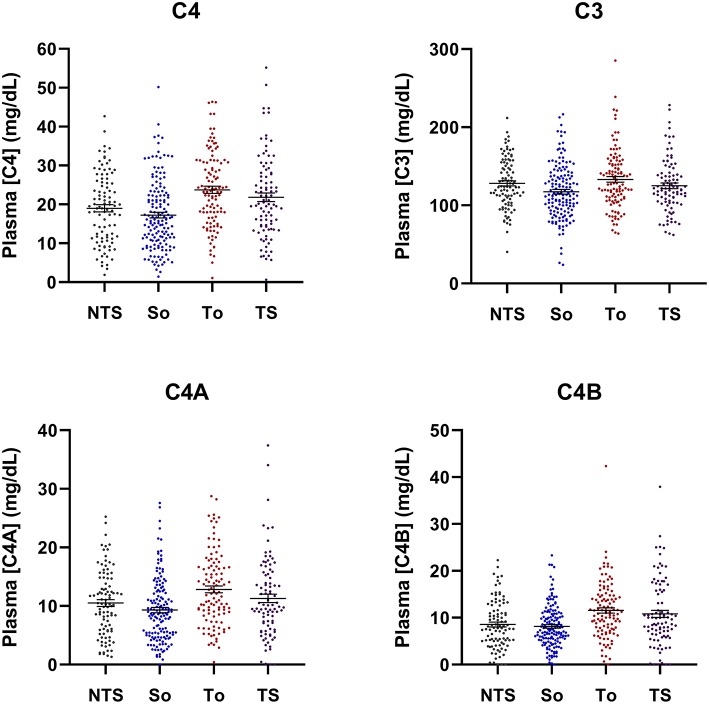
Figure 1.
Scattered-plots of complement C4 and C3 plasma protein concentrations in aPL-positive subjects segregated by thrombosis and SLE status and compared. NTS, no thrombosis and no SLE; So, SLE only, To, thrombosis only; TS, with both thrombosis and SLE. Horizontal bars represent means and standard errors. Overall p-values are: 2.8 × 10⁻⁷ for C4; 0.0024 for C3; 5.9 × 10⁻⁵ for C4A; and 2.7 × 10⁻⁶ for C4B.

