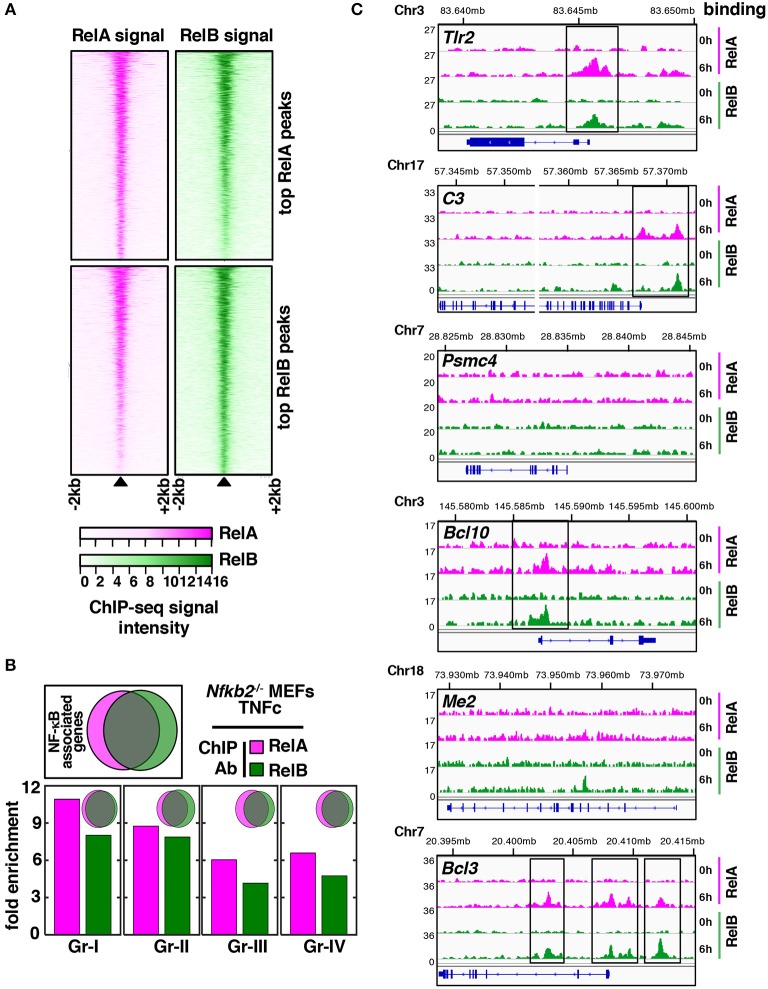
Figure 5.
Overlapping genome-wide distributions of RelA and RelB in TNF-stimulated Nfkb2−/− MEFs. (A) Using ChIP-seq analyses, we captured the genome-wide distribution of RelA and RelB in Nfkb2−/− MEFs subjected to TNFc treatment for 6 h. A peak centered heatmap revealing RelA and RelB binding to chromatin locations surrounding top RelA or top RelB binding peaks. (B) Venn diagrams reveal overlap between RelA- (magenta) and RelB-associated (green) genes globally (top, left) or for the individual gene groups. Bar graphs reveal relative enrichment of RelA-associated and RelB-associated genes for various gene groups. (C) Representative browser tracks of RelA and RelB binding to genes belonging to various gene groups. The y-axis represents normalized reads per 10 million. Chromosomal locations of each gene in mm9 are shown above ChIP-seq tracks.

