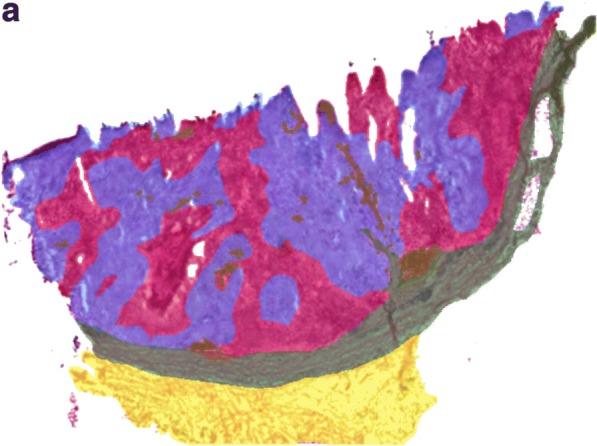
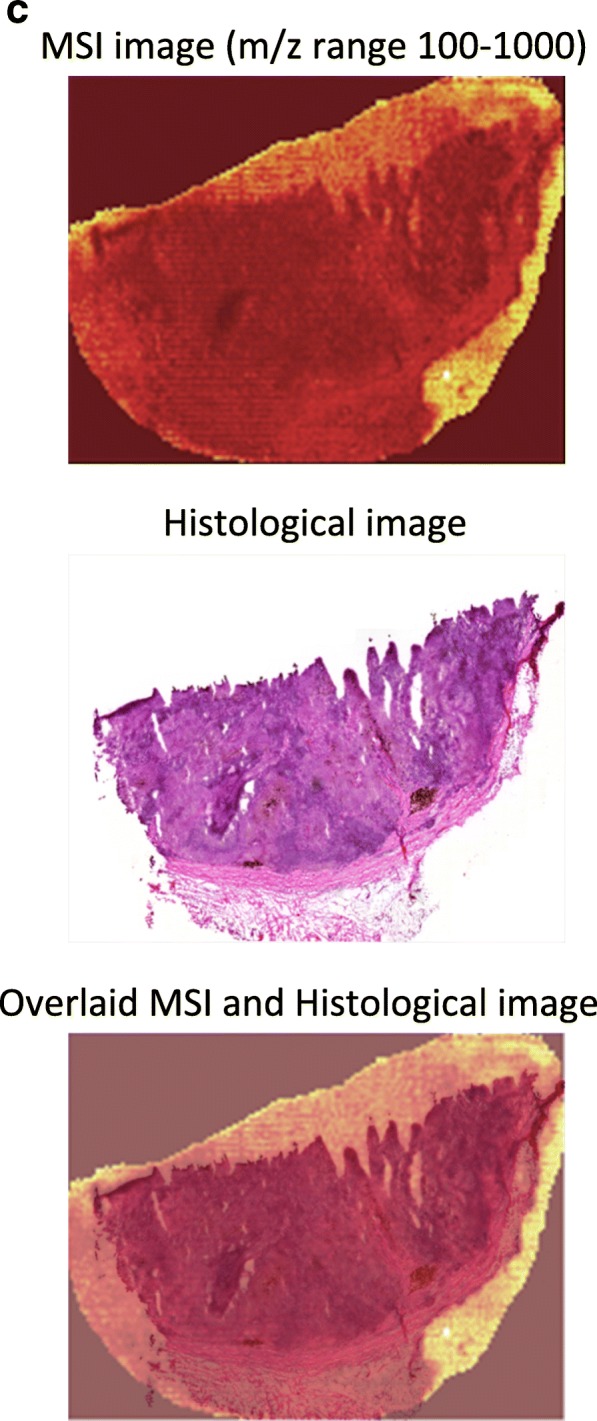
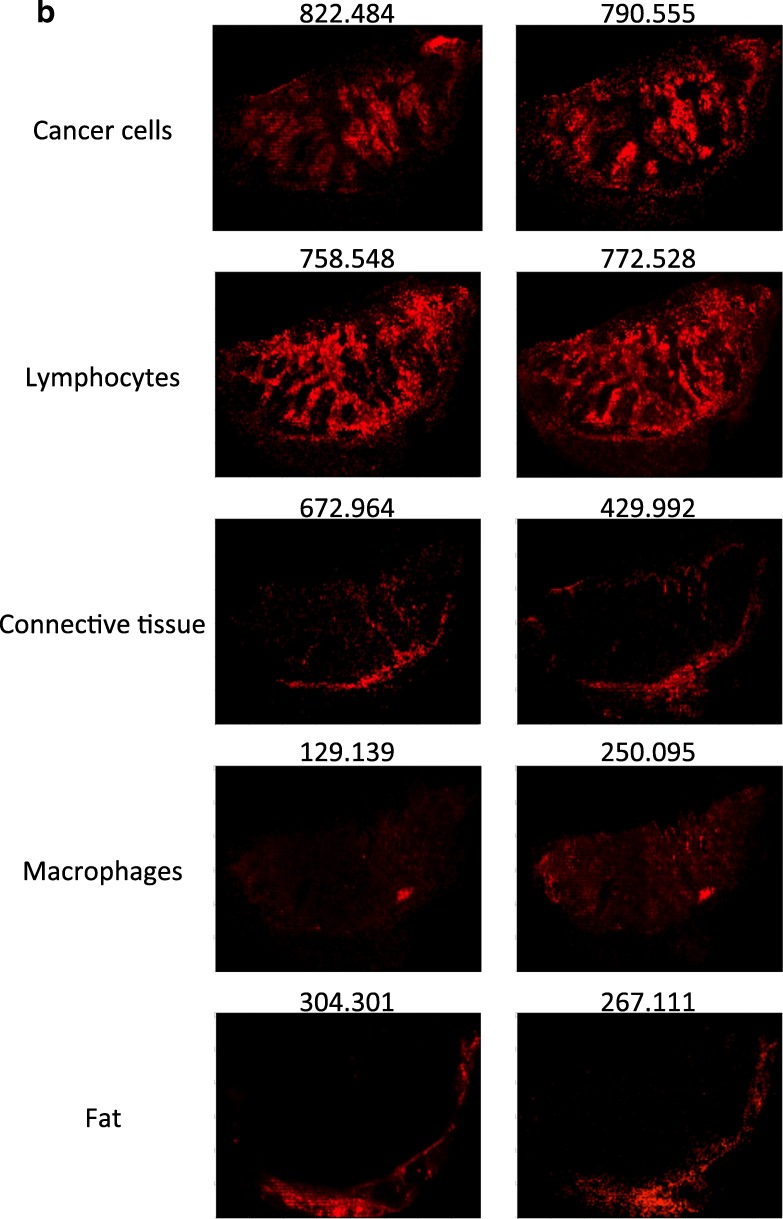
Fig. 5.


a H&E image of an isolated patient tumor section. Each tissue compartment is represented by a different color. Melanoma cells (area 1, purple), lymphocytes (area 2, magenta), macrophages (area 3, brown), connective tissue (area 4, green), and fat (area 5, yellow). b MALDI-MS images from patient tumor tissue isolated after surgery. Endogenous low-molecular weight compounds were analyzed. Images show the tissue distribution of selected masses that were correlated with various tissue compartments, such as melanoma cells, lymphocytes, macrophages, connective tissue, and fat. c A specific mask plane was used to query correlating masses for each investigated region. H&E stained tissue (a), MALDI-MSI data (m/z range 100–1000) from the same tissue slide (b) and the overlaid MSI and histological images (c)

