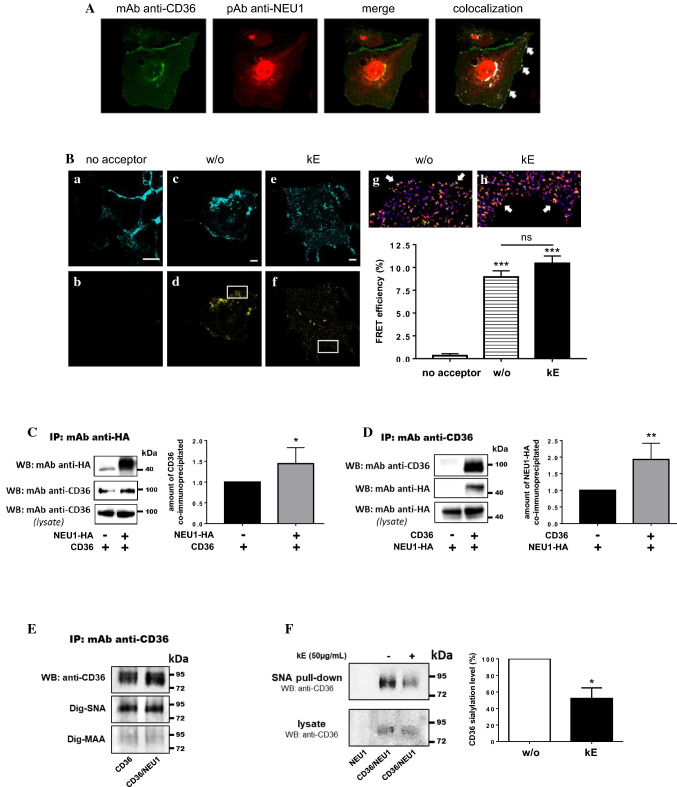
Fig. 3.
Validation of the interaction between NEU1 and CD36 in COS-7 cells and functional consequences on the sialylation level of CD36. A Colocalization of NEU1 and CD36 at the cell surface of COS-7 cells co-expressing human NEU1 and human CD36 by confocal microscopy acquisitions. Areas of colocalization at the plasma membrane are indicated by white arrows. Images are representative of two independent experiments. B FRET experiments in COS-7 cells expressing CD36-Teal (energy donor) or CD36-Teal and NEU1-YFP (energy acceptor). Confocal images after spectral unmixing for the donor (a, c, e) and the acceptor (b, d, f) in a cell incubated (e, f), or not (a–d), with kE (50 µg/mL, 1 h), or without acceptor (a, b). Zoom area of calculated FRET efficiency are presented in Fire LUT for each condition (g, h). White arrows indicate areas of higher FRET efficiency. The graph represents the mean FRET efficiency ± SEM of three independent experiments (three cells/experiment). For each cell, thirty regions of interest of 0.62 µm2 contouring the cell were chosen. Statistical analysis was performed by Student’s t test (***p < 0.001 versus no acceptor; ns non-significant). Scale bar: 10 µm. C Left panel: NEU1-HA was immunoprecipitated with a rabbit monoclonal anti-HA antibody from whole lysate of COS-7 cells expressing CD36 (NEU1-HA−/CD36+) or co-expressing human NEU1-HA and CD36 (NEU1-HA+/CD36+). Co-immunoprecipitation of CD36 was monitored by Western blot using a mouse monoclonal anti-CD36 antibody (1/500). The figure is representative of six independent experiments. Right panel: blot quantification by densitometry analysis. Results are expressed as mean ± SEM of six independent experiments and normalized to NEU1-HA−/CD36+ condition. Statistical analysis was performed by Student’s t test (*p < 0.05). D Left panel: CD36 was immunoprecipitated with a mouse monoclonal anti-CD36 antibody from whole lysate of COS-7 cells expressing NEU1-HA (CD36−/NEU1-HA+) or co-expressing NEU1-HA and CD36 (CD36+/NEU1-HA+). Co-immunoprecipitation of NEU1-HA was monitored by Western blot using a rabbit monoclonal anti-HA antibody (1/1000). The figure is representative of four independent experiments. Right panel: blot quantification by densitometry analysis. Results are expressed as mean ± SEM of four independent experiments and normalized to CD36−/NEU1-HA+ condition. Statistical analysis was performed by Student’s t test (**p < 0.01). E Lectin blotting after immunoprecipitation of CD36 from whole lysates of COS-7 cells expressing CD36 (CD36) or co-expressing CD36 and NEU1 (CD36/NEU1). Nitrocellulose membranes were incubated with digoxigenin-labeled SNA or MAA lectins followed by anti-digoxigenin antibodies coupled to alkaline-phosphatase according to the manufacturer’s instructions. Detection of immunoprecipitated CD36 was revealed as described above. The figure is representative of two independent experiments. F Left panel: SNA pulldown of crude membrane preparations of COS-7 cells expressing NEU1 (NEU1) or co-expressing CD36 and NEU1 (CD36/NEU1), and incubated, or not, with kE (50 µg/mL, 1 h). For each condition, equal amount of proteins was used. The amount of sialylated CD36 recovered after SNA pulldown was evaluated by Western blot using a mouse monoclonal anti-CD36 antibody as described above. The figure is representative of three independent experiments. Right panel: quantification of the sialylation level of CD36 (pulldown/lysate ratio) by densitometry analysis. The sialylation level of CD36 was normalized to the control condition (without kE, w/o). Results are expressed as mean ± SEM of three independent experiments and statistical analysis was performed by Student’s t test (*p < 0.05)

