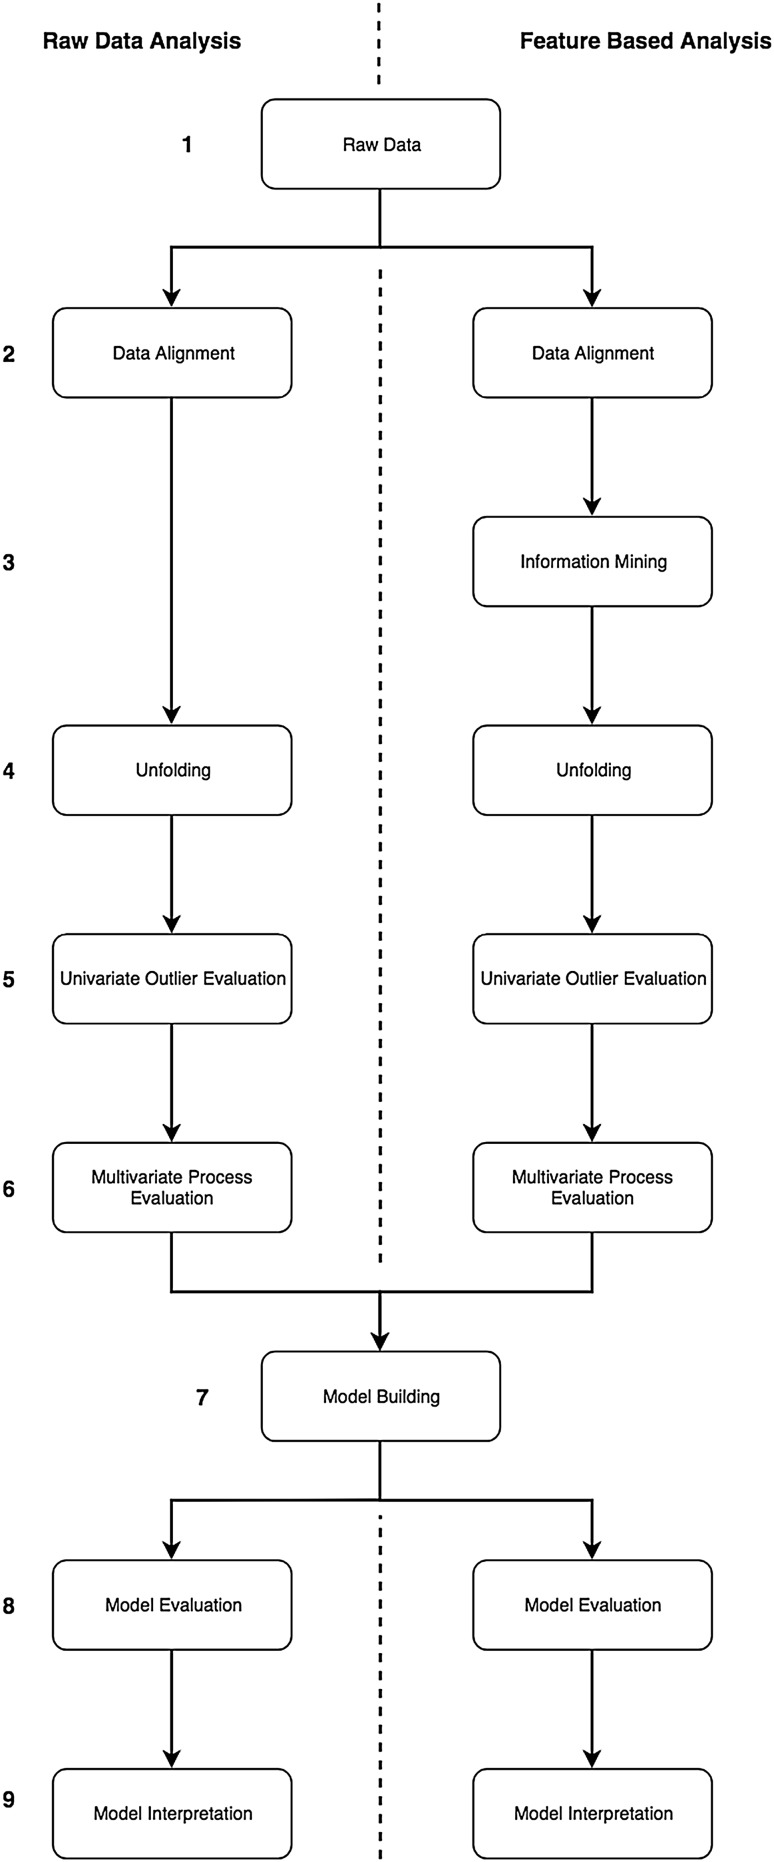
Fig. 1.
Root cause analysis (RCA) workflows. The left side represents the RDA approach (A) and the right side represents the FBA approach (B). Each step is displayed as an individual square. If both approaches use the same methodology, then one square is displayed for both applications. However, if there are differences in the analysis or in the generated plots a separate square for each approach is displayed. In general, it can be seen, that for both applications the same steps are required, except the step 3 “Information Mining” which is a unique step within the FBA

