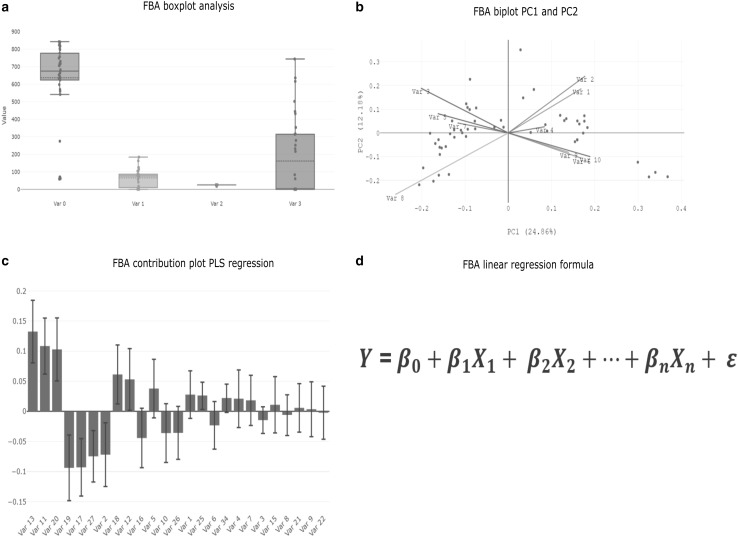
Fig. 3.
Plot summary of the FBA. a Boxplot distribution, of a set of variables, which is used for univariate outlier detection. b Biplot of the principal component 1 and 2 of the performed principal component analysis (PCA). This plot gives a hint of the variable relationships within the multivariate space. c Result of the partial least square (PLS) analysis. This plot indicates the relation of certain variables onto a response, the direction of the blue bar indicates the direction of the dependency. If the black error bar does not include 0 the variable can be seen as statistically significant influencing the response variable. d This formula indicates the final result of the RCA mathematically. Y is the response variable, which can be described by the intercept (β0) and the significant variables (βnXn), where βn is the slope and Xn the values the certain variable n of one of the significant variables out of PLS regression. ε represents the variance of the residual error of all other factors not accounted for. We assume that this error is normal distributed with 0 variance and therefore neglected from the analysis

