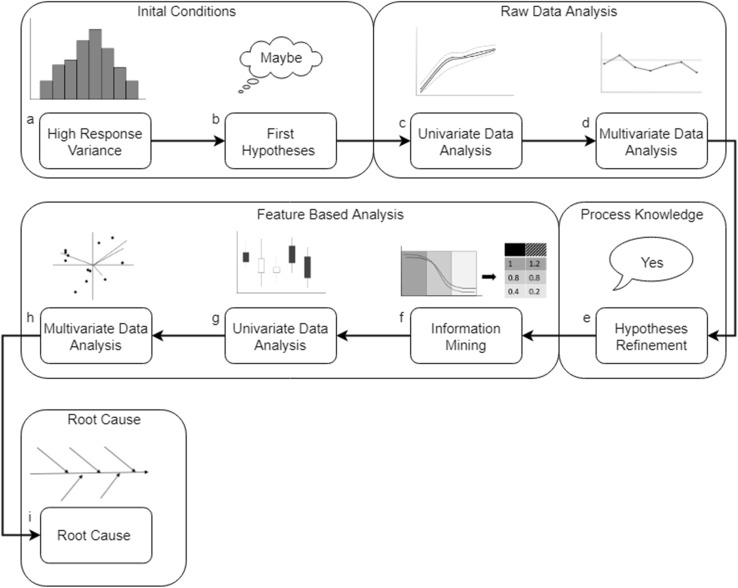
Fig. 6.
Schematic drawing of the suggested root cause analysis (RCA) workflow. a Initial observed variance of a response variable. b First assumption of causing this deviation due to process knowledge and/or literature review. The analysis workflow starts with the raw data analysis (RDA) especially with univariate analysis (c) followed by multivariate process evaluation, d the result of the RDA deepened the process understanding. This results in a better formulation of the final hypotheses for the reason of the observed differences (e). f First step of the feature bases analysis (FBA), the feature extraction due to the refined hypotheses. Univariate data analysis (g), and finally multivariate data analysis (h), result in a comprehensive conclusion about the reason for the response variance (i)

