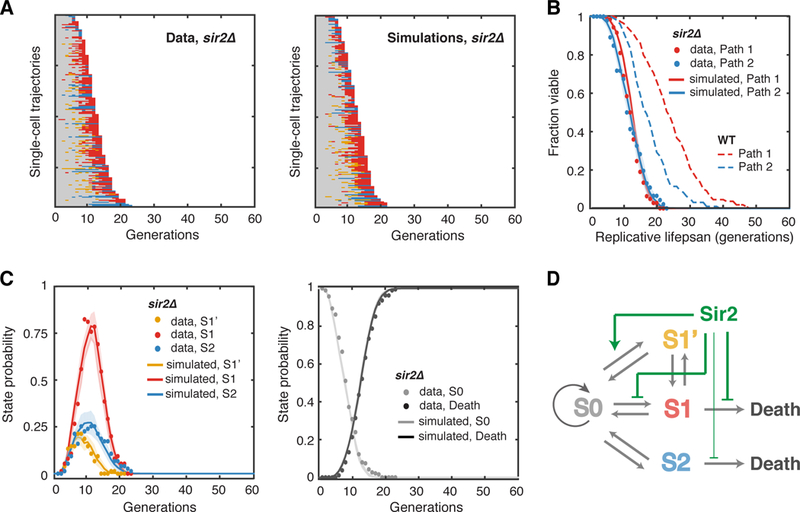
Figure 3. Aging-Dependent State Transitions in the Short-Lived sir2Δ Mutant.

(A) Single-cell state transition trajectories of sir2Δ from the data (188 cells, 142 in Path 1, 46 in Path 2) (left), and from stochastic simulations (right). (B) The lifespans of two aging paths in sir2Δ from experimental data (red and blue solid circles) and from simulations (red and blue curves). Dashed curves are the WT lifespans from Figure. 1F for comparison. (C) Age-dependent state distributions of S1’, S1, S2 and S0 and Death in sir2Δ. Solid circles represent the experimental data. Solid curves represent simulated results averaged from 50 simulations with shaded areas indicating standard deviation. (D) Schematic diagram illustrates the effects of Sir2 at specific state transition steps. See also Table S1, Figures S4, S5 and S9.
