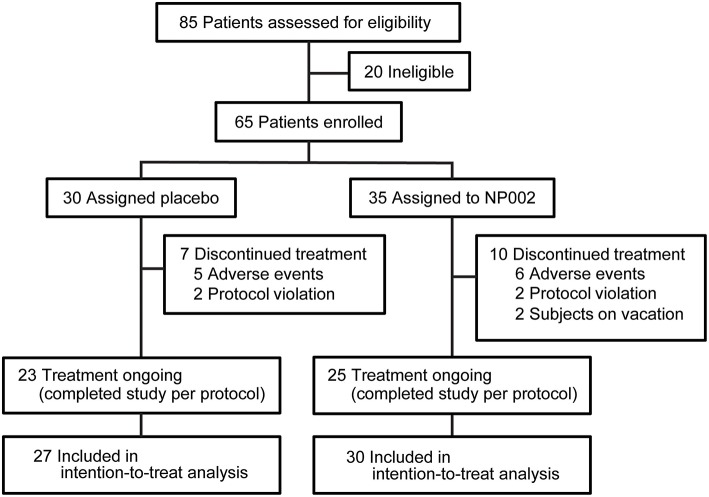
Figure 1.
Trial profile. The number of patients screened and enrolled in the study, as well as the number of patients who left the study at each point and the reasons for exclusion from the study, with the resulting number left enrolled, are shown. All patients who completed at least one postbaseline visit were included in the intention-to-treat analysis, which is also documented in the figure. Used with permission from Barrow Neurological Institute, Phoenix, Arizona.

