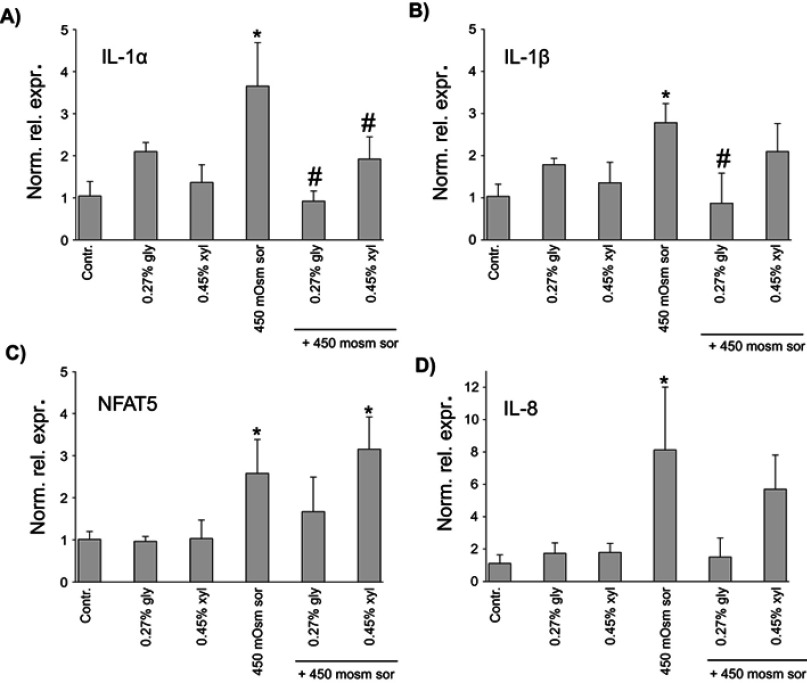
Figure 3.
In vitro effects of polyols on (A) IL-1α, (B) IL-1β, (C) NFAT5 and (D) IL-8 expression. The expression of each gene was normalized to the 18S rRNA gene and relative mRNA levels were calculated by the ΔΔCt method, compared to the untreated, time-matched control samples. Statistical analysis was performed with one-way ANOVA and Holm-Sidak post-hoc test (mean + SD), *p<0.05 vs Contr., #p<0.05 vs 450 mOsm sor, n=3 (a-c) and Kruskal–Wallis one-way analysis of variance on ranks, followed by Dunn’s method (median, 25th and 75th percentile), *p<0.05 vs Contr, n=3 (d) Despite the difference in the statistical tests, mean + SD values are shown in all subfigures for uniform presentation.
Abbreviations: Norm. rel. expr, normalized relative expression; Contr, control; sor, sorbitol; gly, glycerol; xyl, xylitol.

