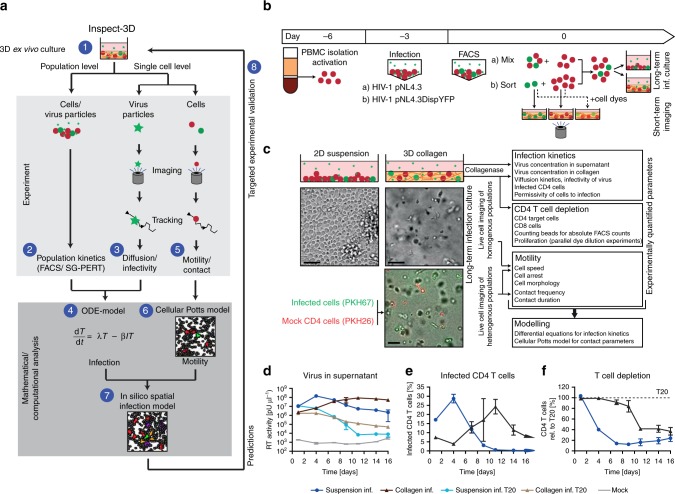
Fig. 1.
INSPECT-3D workflow, experimental system and population analysis of pathogen spread in 3D collagen. a Schematic workflow depicting the different steps of INSPECT-3D. Step 1: Establishment of a 3D culture system (here: primary human CD4 T lymphocytes in collagen to study HIV-1). Steps 2 and 3: Generation of quantitative and kinetic data on pathogen spread on the population level (step 2) and on the level of single pathogens (step 3). Step 4: Use quantitative and time-resolved information from steps 2 and 3 to parametrize a model based on ordinary differential equations (ODE) describing the kinetics of pathogen spread. Step 5: Generation of quantitative and kinetic data on cell motility and contact parameters. Step 6: Use quantitative and time-resolved information from step 5 to generate a cellular Potts model describing cell motility. Step 7: Combine both modeling approaches (steps 4 and 7) into an in silico integrated spatial infection model. Step 8: Experimental validation of predictions from the in silico integrated spatial infection model. Infected cells: green, target cells: red, virus: green asterisks, CD8 cells: purple, newly infected cells in eclipse phase: orange. b Schematic overview of experimental procedure of PBMC isolation, activation, infection and set up of long-term infection cultures or short-term imaging. Infected T cells (green) can be separated from uninfected T cells (red) by MACS sorting of cells infected with the HIV-1 variant NL4.3Disp.YFP. c Schematic overview of the parameters that can be quantified by INSPECT-3D. Depicted in the top panel are schematic views of 2D suspension and 3D collagen cultures with uninfected and infected cells in red and green, respectively. Asterisks: virus. The middle panel shows a wide-field micrograph of cell density and arrangement, the lower panel a still image from a movie of a 3D culture with uninfected (red, PKH26 stained) and infected (green, PKH67 stained) cells. Scale bars: 40 µm. d–f HIV-1 spread in suspension or collagen. d Virus concentration in supernatants determined by SG-PERT. e Percentage of infected (p24+) CD4 T cells determined by flow cytometry. f T cell depletion expressed as residual CD4 T cells relative to the respective T20 control, which was set to 100% (dashed line). Mean and standard deviation from parallel triplicate infections of cells from the same donors are shown

