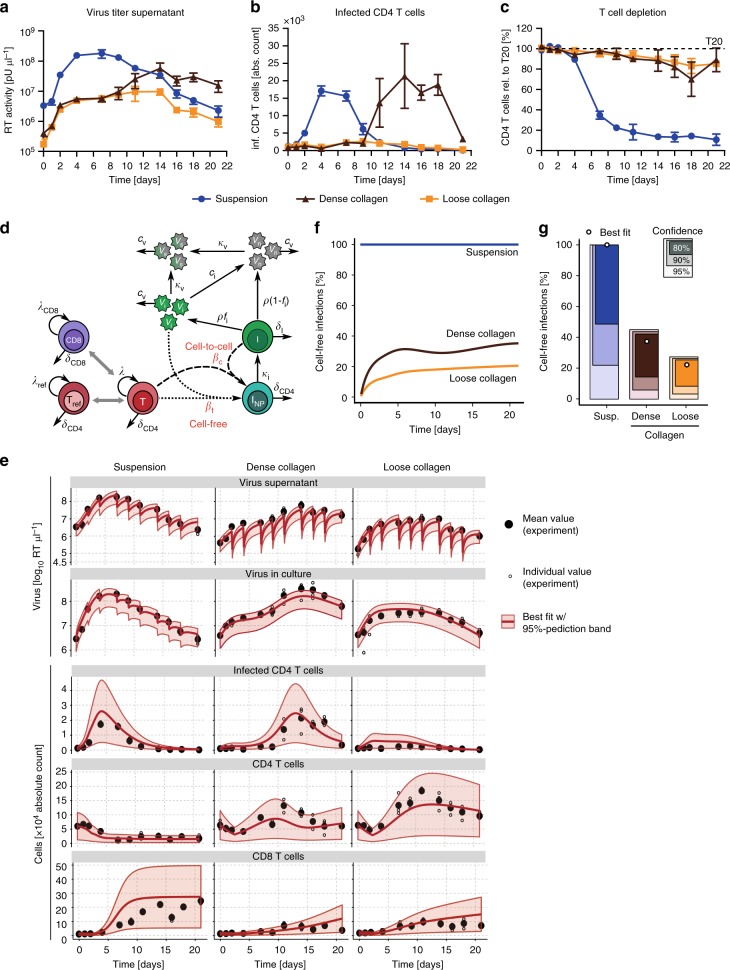
Fig. 3.
Step 4: Mathematical ODE-model reveals predominant cell–cell spread of HIV-1 in 3D culture. a–c Cells from a representative donor showing HIV-1 spread in suspension, dense and loose collagen over time. a Virus concentrations determined from supernatants by SG-PERT. b Absolute numbers of infected CD4 cells as determined by FACS using counting beads. c T-cell depletion expressed as residual CD4 T cells relative to the respective T20 control, which was set to 100% (dashed line). Mean and standard deviation from parallel triplicate infections of cells from the same donors are shown. d Schematic of the mathematical model describing the infection dynamics within the ex vivo cultures. Target cells (T) that proliferate at rate λ and die at rate δCD4 can become infected (INP) by free infectious virus (Vi) at rate βf or by contact with infectious cells (I) at rate βc. After remaining in a non-productive infected state for an average duration of 1/κI, infected cells start producing virions at a constant rate ρ and thereby become infectious. Only a fraction of these particles, fi, is considered to be infectious, losing infectivity (Vn) at rate ci. Virions are lost from the culture by either disintegrating with a viral clearance rate cV or by diffusion to the supernatant (VS) at rate κV. Furthermore, we consider non-permissive refractory CD4 T cells (Tref) and CD8 T cells that interfere with target cell proliferation (see Methods for a detailed description and the corresponding mathematical equations). e Model predictions for the infection dynamics within the different environments. The experimental data indicating the mean (black dots) and individual measurements (open black circles) of three repeats, as well as the best fit (solid red line) of the mathematical model given in (d) are shown. Red shaded areas indicate the 95%-prediction bands of model predictions. Note that the repeated drops in virus titer reflect the time points of medium change. f Predicted contribution of cell-free infections to total infections for suspension (blue), dense (brown), and loose collagen (orange) over time using the best fit shown in (e). g Corresponding confidence intervals for estimates of the proportion of cell-free infections three weeks post infection with the prediction of the best fit shown as white circle

