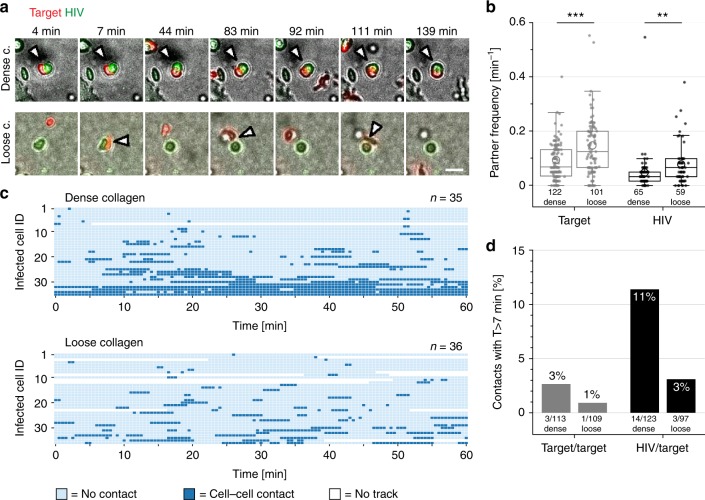
Fig. 5.
Step 5: Cell contact analysis in different collagen densities. Contact analysis of target CD4 T cells in co-culture with HIV-1 infected donor cells. Mock CD4 T cells and purified HIV-1 infected cells were stained with red and green PKH cell dyes, respectively, mixed and embedded in loose or dense collagen. Cells were imaged every 30 s, segmented and tracked for 60 min. a Still images of supplementary movie 3 recorded at the indicated times. Green: HIV-1 infected cell (HIV), red: target CD4 T cell (target). Contacts are indicated by an arrowhead. Scale bar 20 µm. b Partner frequency per min of target or donor cells with other cells in dense and loose collagen. Numbers indicate absolute cell number. The graph shows boxplots with Tukey style whiskers, circles indicate mean values. Mann–Whitney test was used for statistical analysis. c Contact diagram for donor cells with target cells in dense and loose collagen. Individual cell tracks are color coded: light blue, without contact; dark blue, in contact with another cell; white, the track has ended/not yet begun. d Frequency of contacts lasting longer than 7 min between two uninfected cells (target/target) or infected/uninfected cell pairs (HIV/target). Numbers indicate absolute cell contact number

