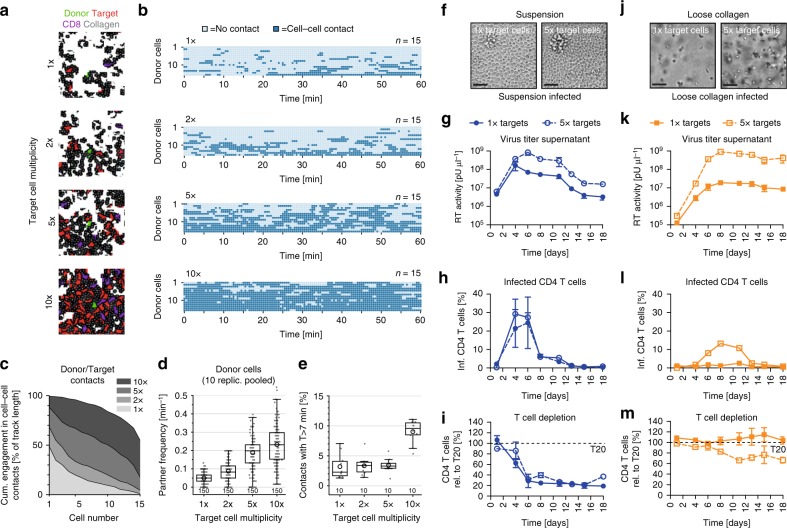
Fig. 7.
Step 8: Experimental validation of model prediction shows dependency of HIV spread on target cell concentrations in loose collagen. a Snapshots of in silico spatial infection model simulations for loose collagen (gray) using a constant number of infected donor cells (green) mixed with varying concentrations (1×–10×) of uninfected CD4 target cells (red) and CD8 cells (purple). b Contact diagram for simulated donor cells with target cells in loose collagen for varying target cell concentrations. Individual cell tracks are color coded: light blue, without contact, dark blue, in contact with another cell. One representative simulation of 10 replicates is shown. c Corresponding cumulative cell–cell contact durations of simulated donor cells from panel (b). d Partner frequency of individual HIV-1 infected donor cells pooled from 10 independent simulations with 15 cells each (150 cells total) followed over 1 h for each concentration of target cells. The graph shows boxplots with Tukey style whiskers, circles indicate mean values. e Proportion of long-lasting cell contacts (>7 min) between infected and target cells from 10 independent simulations. f–m Experimental data for comparison of the infection dynamics in suspension (blue, f–i) and loose collagen (orange, j–m) using the standard (1×, solid lines) and fivefold increased (dashed lines) concentration of target cells. Scale bar of representative bright-field images: 40 µm. g, k Virus concentrations determined from supernatants by SG-PERT. h, l Percentage of infected (p24+) CD4 T cells determined by flow cytometry. i, m T cell depletion as residual CD4 T cells relative to respective T20 control, which was set to 100% (black dashed line). Mean and standard deviation from parallel triplicate infections of cells from the same donors are shown

