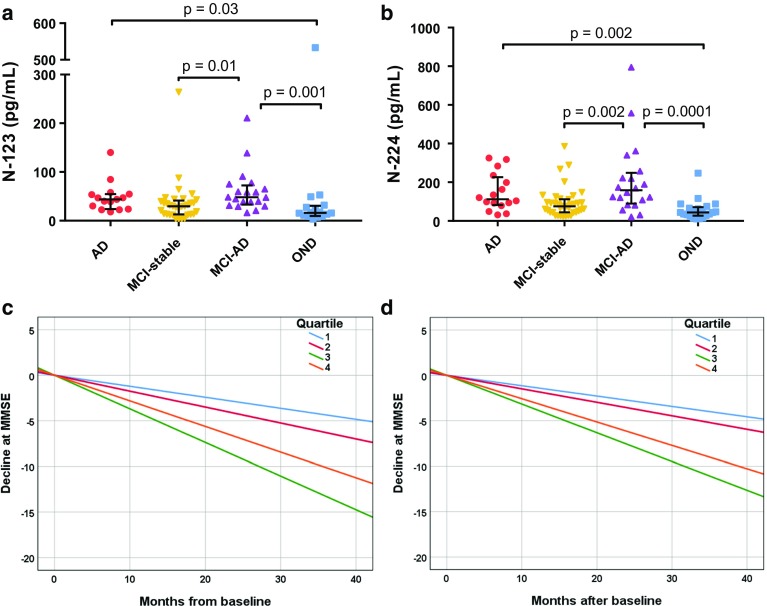
Fig. 7.
Longitudinal cohort. a, b Concentration range of N-123 (a) and N-224 (b) fragments in AD, MCI, and MCI-AD and OND (lines representing the median, bars representing interquartile range). c, d Disease progression over time in AD, MCI-AD and MCI cohorts, as measured by change in MMSE scores. Higher levels of CSF N-123 (a) and N-224 (b) tau at baseline are related to faster decline. N-123: Quartile (Q) 1: n = 16, Q2: n = 15, Q3: n = 15 and Q4: n = 16; N-224: Q1: n = 17, Q2: n = 17, Q3: n = 17, and Q4: n = 17

