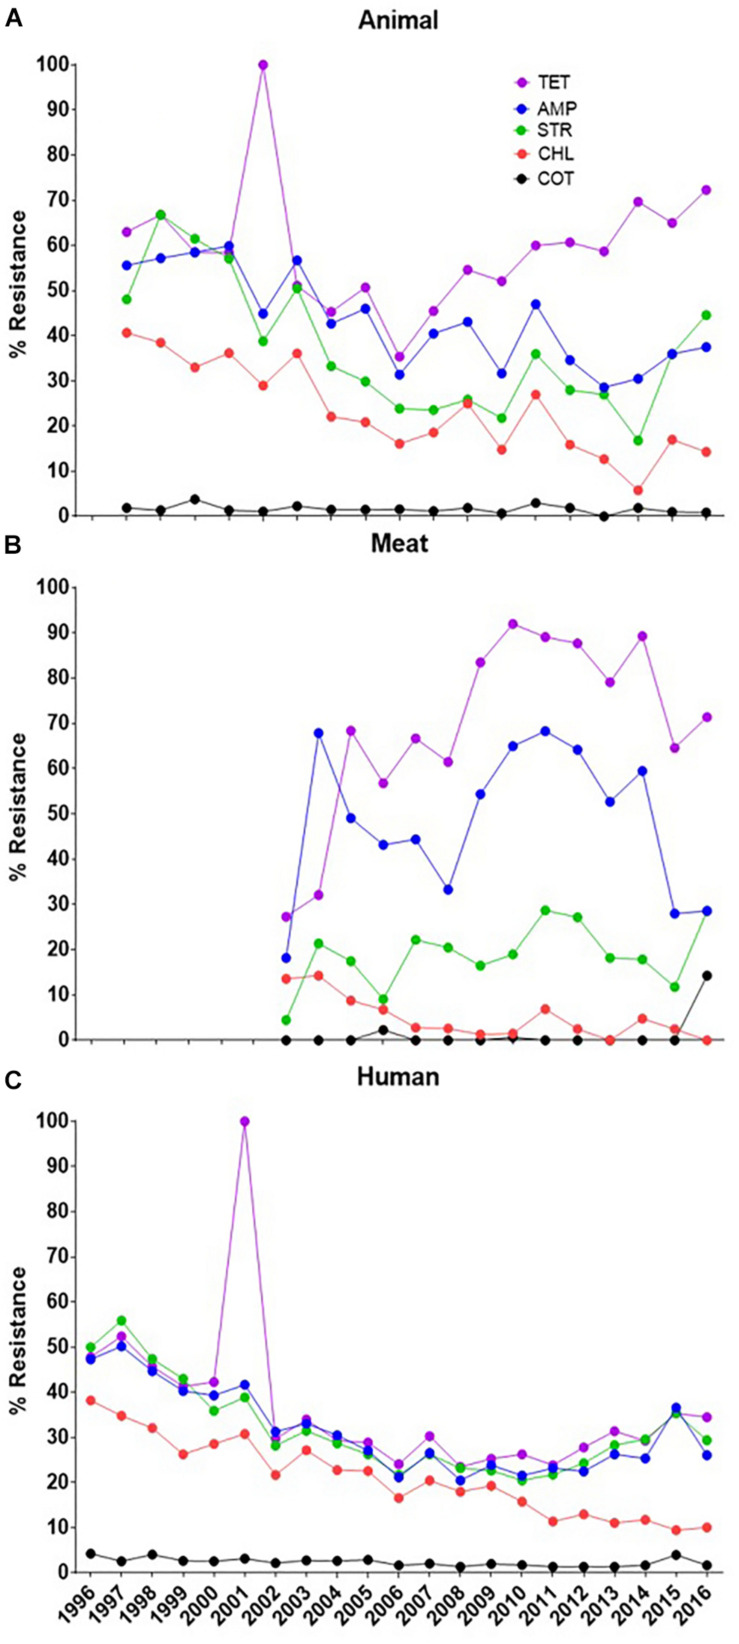
FIGURE 1.
General trend analysis of antibiotic resistance for some certain commonly used molecules (denoted by the color of the lines as given in legend). (A) The resistance pattern in animal isolates, (B) the resistance pattern in meat isolates and (C) the resistance pattern for the human isolates. The XX’ presents the time of data collection while YY’ gives the resistance percent. [Tetracycline (TET), Ampicillin (AMP), Streptomycin (STR), Chloramphenicol (CHL), Sulfamethoxazole-trimethoprim (COT)].

