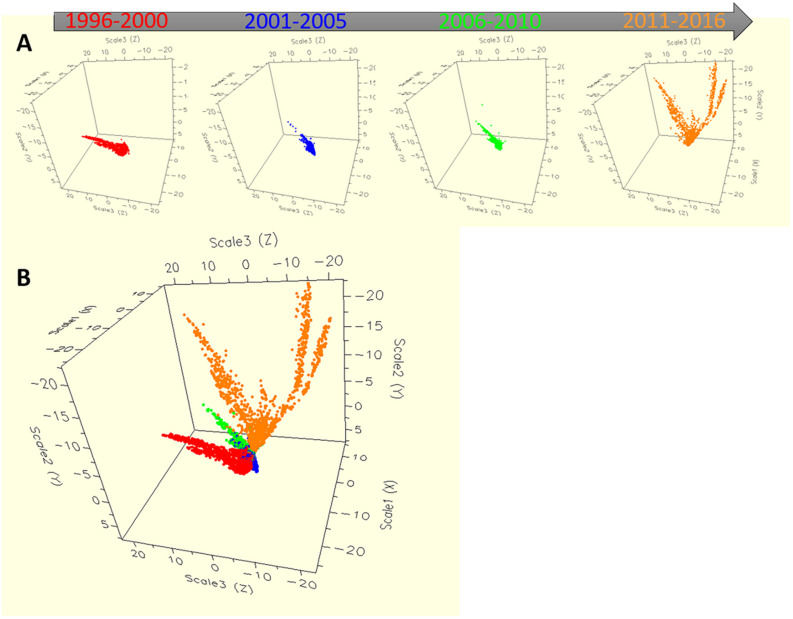
FIGURE 2.
The dynamics of antibiotic resistance features of Salmonella Typhimurium strains across 21 years in the United States. The multidimensional scaling plot of 11,447 Salmonella Typhimurium strains with MIC values for each bacterial isolate were used for producing the proximity matrices, where x-, y- and z- axes are the multidimensional scaling coordinates. Bacterial isolates with similar MIC values are represented by points close one to the other, whereas isolates with dissimilar antibiotic resistant MIC values are represented by separated points. Each bacterium was indicated as individual dot, where colors represented four different periods. (A) The dynamics of antibiotic resistance for four separate time periods. Time period 1 from the year 1996 to 2000, time period 2 from the year 2001 to 2005, time period 3 from the year 2006 to 2010 and time period 4 from the year 2011 to 2016. (B) The dynamics of antibiotic resistance for all four time periods describing together.

