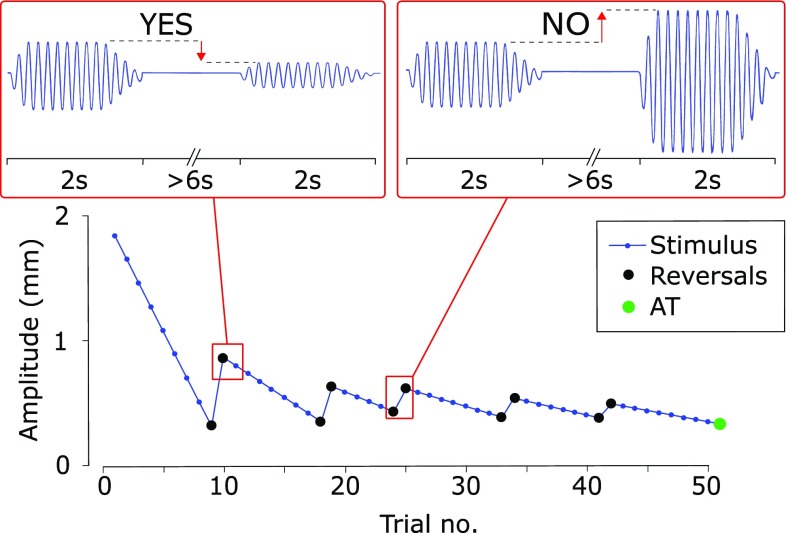
Fig. 2.
Experiment trials. For each experimental condition (3 stimulated points × 2 PF ranges = 6 conditions for the first experiment; 3 stimulated points × 1 PF range = 3 conditions for the second experiment), the subjects received 50 stimulation trials. The experimenter changed the amplitude of the stimulation according to a stochastic approximation staircase (SAS, see text) targeting 85% detection threshold. In particular, the vibration amplitude decreased if the subject perceived an illusion of movement (top left box), otherwise it increased (top right box). The amplitude threshold (AT) was chosen as the stimulation amplitude that would have been presented on the 51st stimulation. The stimulation lasted for 2 s and a pause between 6 and 20 s separated two consecutive stimulations to allow the subjects to report on the presence of the IoM

