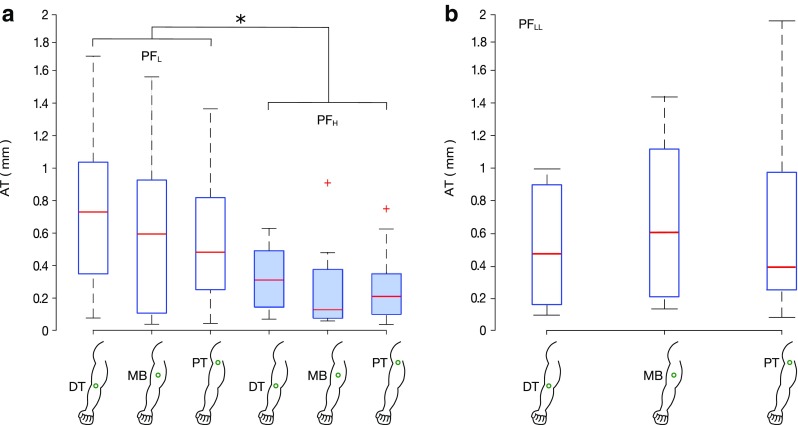
Fig. 4.

Minimum stimulation amplitude (amplitude threshold, AT) eliciting an illusion of movement. a In the first experiment, the AT was found to be affected by the PF range used (F(1,11) = 25.5, p = 0.0004). No statistical difference was found between different stimulation points (F(2,22) = 1.32, p = 0.28). PFL (empty bars) and PFH (filled bars) indicate the lower (1–2 N) and higher (3–4 N) preload force ranges, respectively. b In the second experiment, with a PFLL range (0.5–0.75 N), the stimulation point did not influence the AT eliciting an IoM as well (F(2,22) = 1.160, p = 0.332). DT, MB and PT indicate the distal tendon, the muscle belly and the proximal tendon, respectively. *p < 0.05, +outliers defined as the points outside the interval [q1–1.5(q3 – q1), q3 + 1.5(q3 – q1)], where q1 and q3 are the 25th and 75th percentiles, respectively
