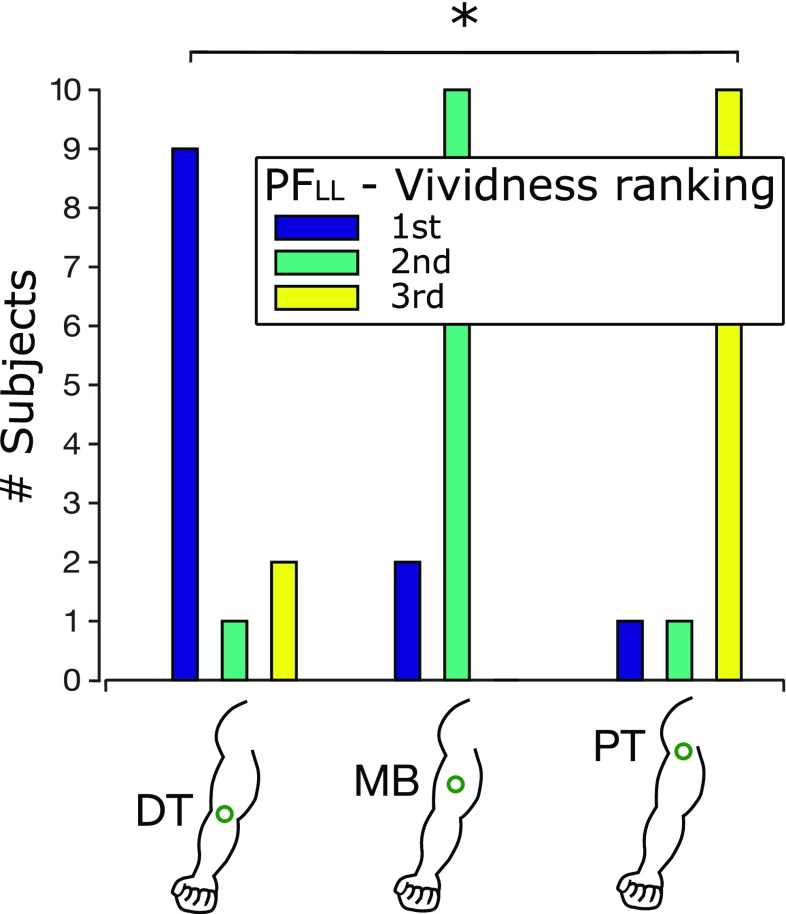
Fig. 5.
Vividness of the IoM (second experiment; PFLL=0.5–0.75 N). The subjects ranked the points of stimulation according to the strength of the IoM. Most subjects ranked the DT first (blue bar), i.e. the point with the strongest IoM, the MB second (green bar) and the PT third (yellow bar). A statistically different perception of the IoM emerged between the DT and the PT (p = 0.036). DT, MB and PT indicate the distal tendon, the muscle belly and the proximal tendon, respectively

