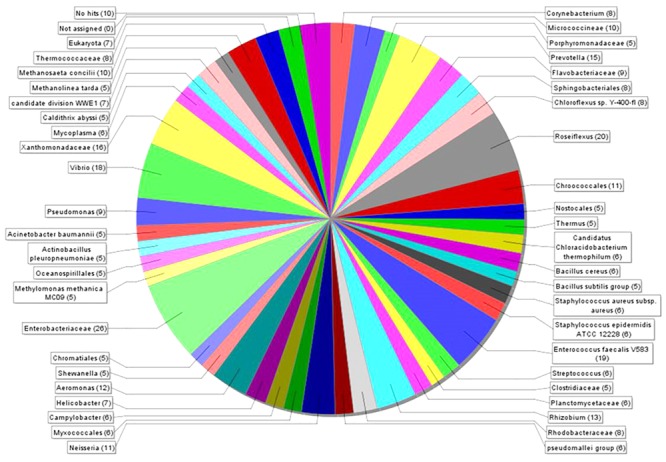
FIGURE 3.

The taxonomic breakdown of microbial diversity analyzed with MEGAN 5. Visualization of the different taxonomic groups encoding 862 DNase-like genes in the bacterial genome and metagenome datasets. Each color represents individual taxonomic groups in the NCBI taxonomy and the number in the brackets denote the number of gene reads assigned to them.
