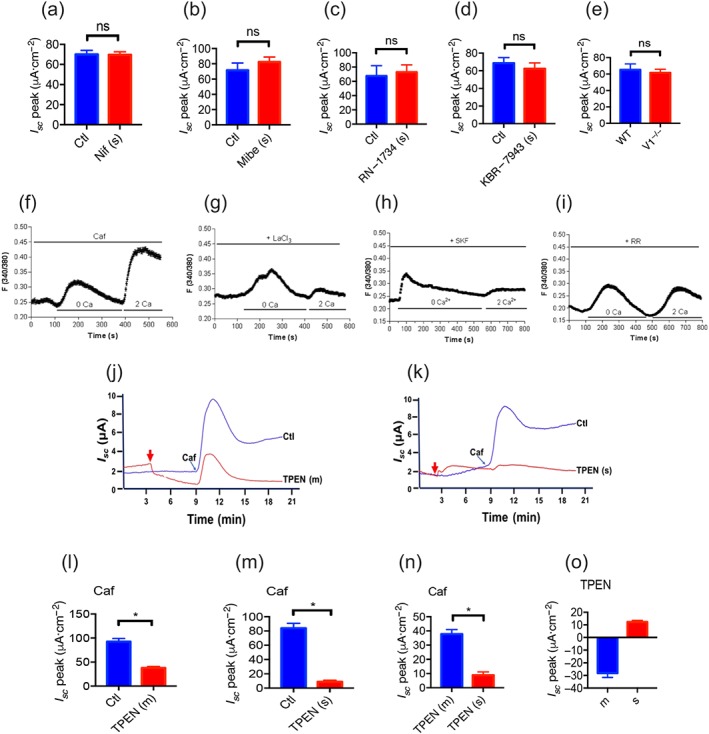
Figure 3.

Ca2+ channels and ER Ca2+ in caffeine‐stimulated duodenal anion secretion and caffeine‐mediated SOCE mechanism in small intestinal epithelial cells. (a–d) Summary data of caffeine (Caf; 10 mM)‐stimulated duodenal I sc peak after serosal side (s) addition of nifedipine (Nif, 10 μ, n = 6), mibefradil (Mibe, 10 μ, n = 6), RN‐1734 (30 μM, n = 7), or KBR‐7943 (30 μM, n = 7). Ctl represents as the control without drug treatment. (e) Summary data of caffeine‐stimulated duodenal I sc peak compared between TRPV1 knockout mice (V1−/−, n = 9) and wild‐type mice (WT, n = 8). (f) Summary data showing the time courses of caffeine (10 mM)‐induced Ca2+ signalling in the absence (0 Ca, left) or the presence of extracellular Ca2+ (2 Ca, right) in SCBN cells as a control. (g–i) Summary data showing the effect of LaCl3 (30 μM), SKF‐96365 (SKF, 30 μM), or ruthenium red (RR, 30 μM) on the time courses of caffeine‐induced Ca2+ signalling in the absence or the presence of extracellular Ca2+. Results are presented as mean of 50–60 SCBN cells for each panel. (j–m) Representative time courses and summary data of caffeine‐stimulated duodenal I sc after mucosal (m) or serosal (s) addition of TPEN (1 mM, n = 6). Ctl represents as the control without TPEN treatment. (n) Comparison of caffeine‐stimulated I sc peak after mucosal or serosal addition of TPEN. (o) Summary data on the direct effect of TPEN on basal I sc after mucosal or serosal addition. * P < 0.05, significantly different from the corresponding control or mucosal addition of TPEN
