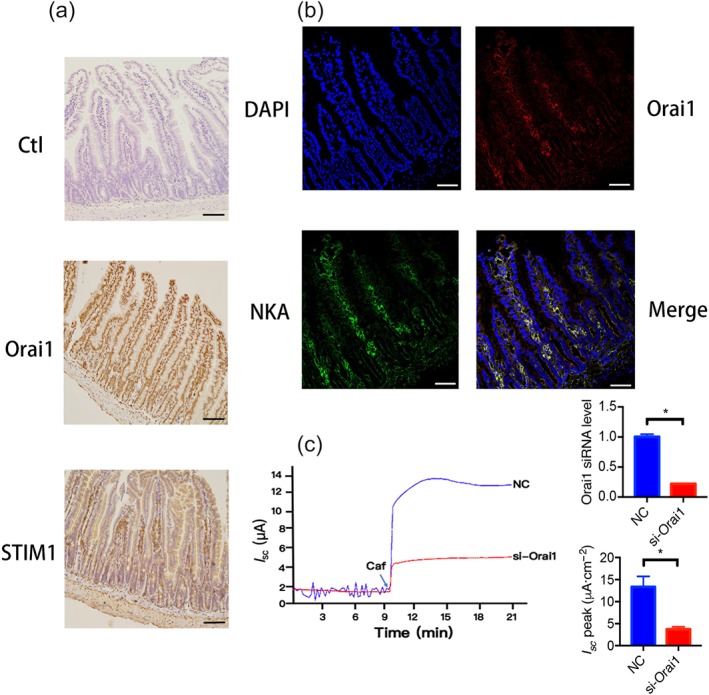
Figure 9.

Expression of STIM1/Orai1 and localization of Orai1 in villous cells of mouse duodenal epithelia. (a) The expression of STIM1 and Orai1 in the duodenal epithelia detected by immunohistochemistry. The upper panel showing the typical villous cells of duodenal epithelia without the primary antibodies against Orai1 and STIM1 as a negative control. The middle and lower panels showing the specific brown staining to Orai1 and STIM1 proteins in the villous cells. (b) The localization of Orai1 in the villous cells of duodenal epithelia identified by immunofluorescence staining. The upper left panel showing the nuclei of the villous cells stained with DAPI (blue). The upper right panel showing the specific staining to Orai1 proteins in the villous cells (red). The lower left panel showing the basolateral marker of Na+, K+‐ATPase (NKA) in the villous cells (green) as a positive control. The upper right panel is the merge of the above three image showing the co‐localization of Orai1 and NKA on the basolateral membrane of villous cells (yellow). Each one is the representative of all images taken from the duodenum of three mice with similar results. Scale bar = 50 μm for each image. (c) Representative time courses and summary data showing the inhibitory effect of si‐Orai1 on caffeine (Caf)‐stimulated I sc compared to negative control (NC) after serosal addition to Caco‐2 cells (s, n = 6), and summary data of Orai1 mRNA levels determined by qPCR in Caco‐2 cells (n = 6). * P < 0.05, significantly different from the corresponding control
