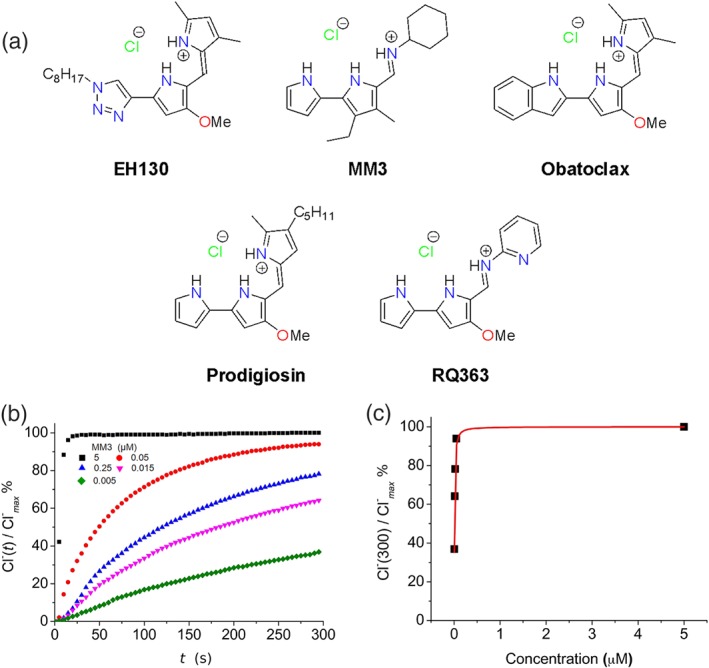
Figure 1.

(a) Chemical structures of the studied compounds. (b) Chloride efflux promoted by MM3 at different concentrations (5 μM, 0.05 μM; 0.025 μM, 0.015 μM, 0.005 μM) in LUV. Vesicles loaded with 489 mM NaCl were buffered at pH 7.2 with 5 mM phosphate and dispersed in 489 mM NaNO3 buffered at pH 7.2. Each trace represents the average of three independent measurements. (c) The normalised chloride efflux at 300 s plotted against the anionophore concentration. The dose–response curve was constructed from 15 independent measurements. Data have been fitted with Hill equation (continuous line), which yields an EC50 of 0.0083 μM
