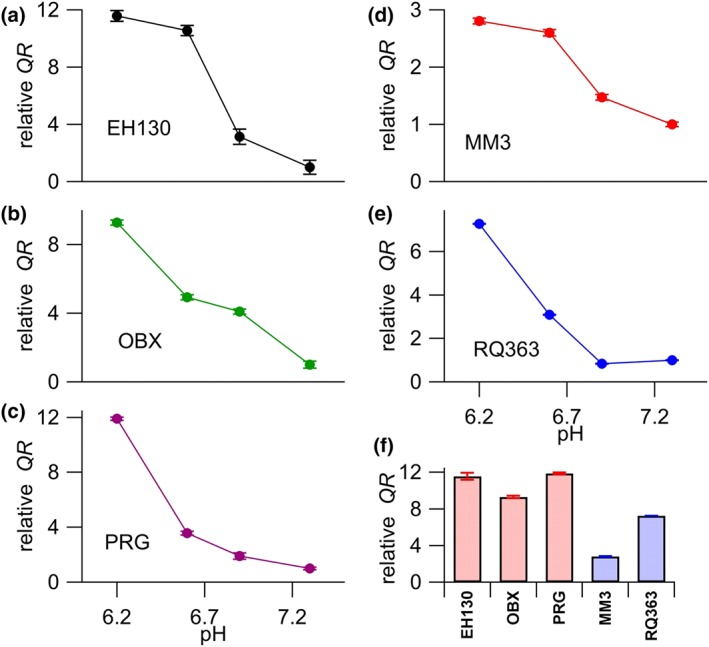
Figure 5.

The QR values, normalised to the value measured at pH 7.3, are plotted against the pH of the extracellular solution, for 2 μM of EH130 (a), OBX (b), PRG (c), MM3 (d), and RQ363 (e). The abscissa of panels (a) and (b) are the same as panel (c), and the abscissa of panel (d) is the same as that of panel (e). The number of measures for each anionophore at a given pH value was between six and 61. The normalised QR, showing the change produced by the reduction of pH from 7.3 to 6.2 is shown in (f). There, the bars representing prodigiosines are shown in red, and those for tambjamines are in blue
