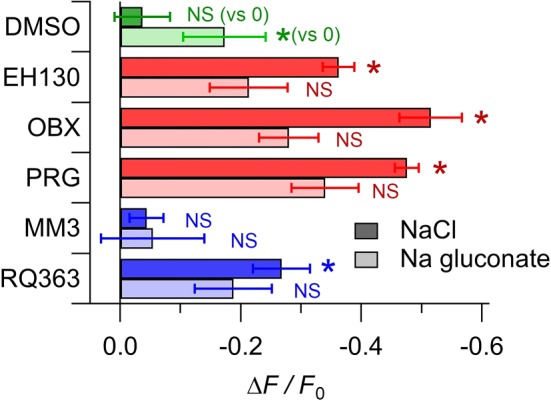
Figure 7.

Relative change of the probe DiBAC4(3) fluorescence, normalised to the fluorescence of the untreated cells, measured in control cells treated with DMSO, and in cells incubated with 2 μM of different anionophores. Data shown are means ± SEM from at least 10 independent measurements. The DMSO controls were compared to the zero value; data from the cells treated with anionophores in the presence of chloride were compared with data from DMSO treated cells in the presence of chloride: data from the cells treated with anionophores in the presence of gluconate were compared with data from DMSO treated cells in the presence of gluconate. *P < 0.05, significantly different from corresponding DMSO value; NS, no significant difference; Student's t test
