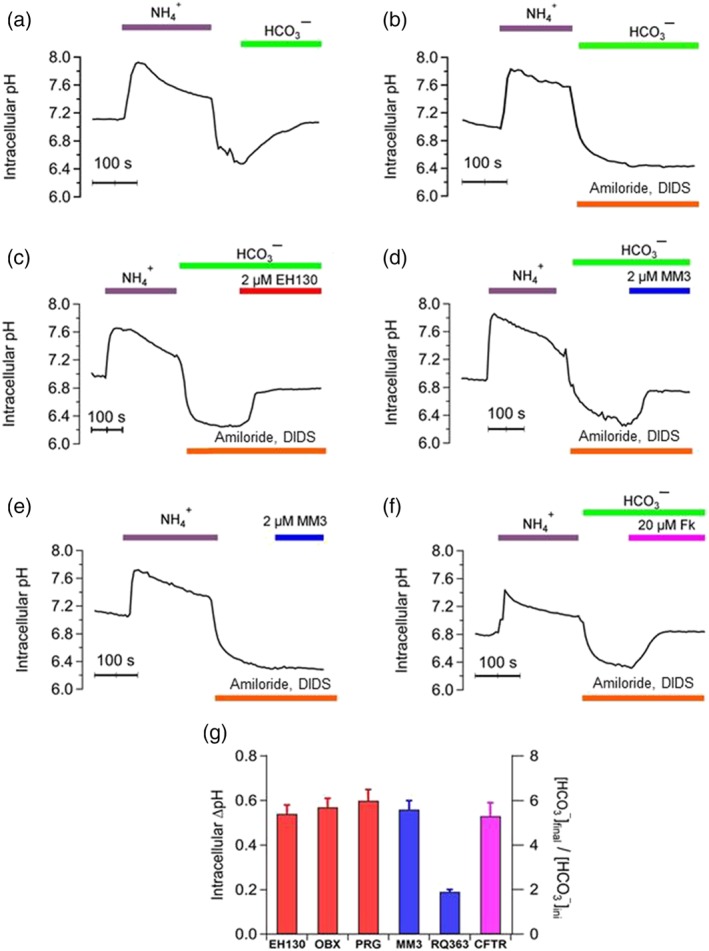
Figure 8.

Intracellular pH measured during a NH4 + pulse protocol. Perfusion of FRT (a–e) and CFTR‐FRT cells (f) with solutions saturated with 5% CO2 are indicated at the top of the traces. (a) Perfusion with 40 mM NH4 + causes the alkalinisation of the cell, followed by a rapid acidification when external NH4 + is removed. Perfusion with bicarbonate immediately induced a pHi increase, correlated with the bicarbonate influx. (b) The main bicarbonate and proton transport mechanisms were inhibited by 1 mM amiloride and 300 μM DIDS and therefore, there is no pHi change. Perfusion with 2 μM EH130 (c ) or 2 μM MM3 (d), in the presence of amiloride and DIDS, induced a pHi increase correlated with bicarbonate influx. (e) When anionophore is perfused in the absence of bicarbonate, there is no pHi change. (f) Similar experiments were performed on FRT–CFTR cells. Also, in this case, no pHi increase was observed until the activation of CFTR by forskolin (20 μM Fk). Each curve is the mean of at least four different regions in the acquired images. (g) The change of the pHi, correlated with bicarbonate influx, upon perfusion of the cells with 2 μM of the prodigiosines EH130, OBX and PRG (red bars), the tambjamines MM3 and RQ363 (blue bars), and the activation of the CFTR by 20 μM forskolin. Data are the mean ± SEM of five independent experiments
