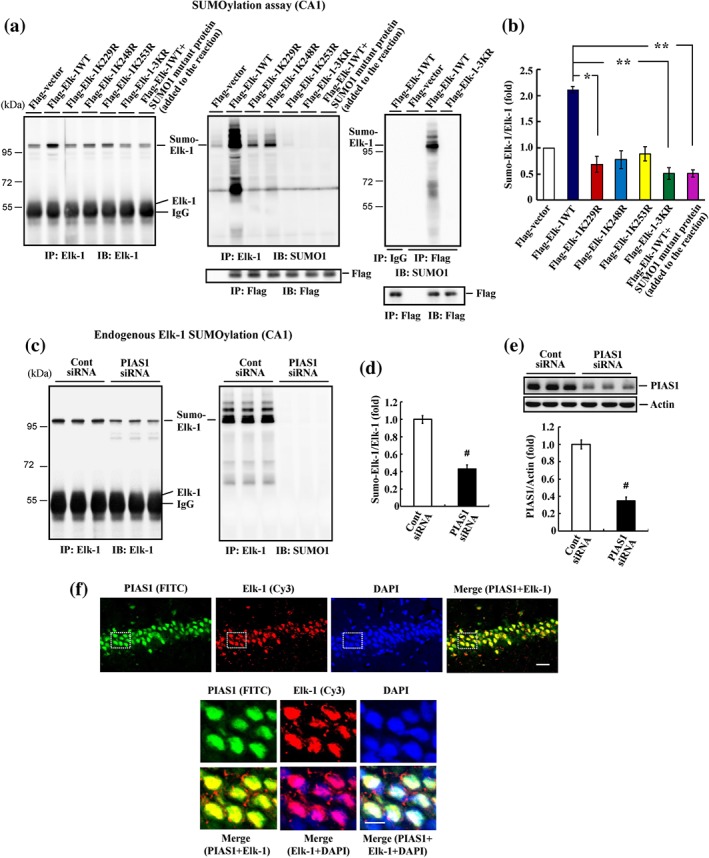
Figure 5.

Elk‐1 is SUMO‐modified by PIAS1 endogenously in the hippocampus. (a) Flag‐vector, Flag‐Elk‐1WT (with or without SUMO1 mutant protein added to the reaction), individual Flag‐Elk‐1 mutant plasmid, or Flag‐Elk‐1 3KR mutant plasmid was transfected to rat hippocampal CA1 area, and Elk‐1 SUMOylation was determined by SUMOylation assay 48 hr later. Anti‐Elk‐1 antibody (left) and anti‐SUMO1 antibody (middle) were used for immunoblotting after immunoprecipitation with anti‐Elk‐1 antibody. Immunoprecipitation and western blot using anti‐Flag antibody confirm the transfection and expression of Flag‐tagged plasmids (middle‐lower panel). Flag‐vector, Flag‐Elk‐1WT, or Flag‐Elk‐1 3KR plasmid was transfected to rat CA1 area, and tissue lysate was immunoprecipitated with anti‐Flag antibody and immunoblotted with anti‐SUMO1 antibody. An additional group of rats received Flag‐Elk‐1WT transfection but was immunoprecipitated with IgG to serve as the control. Tissue lysate was similarly immunoprecipitated and immunoblotted with anti‐Flag antibody to confirm the transfection and expression and Flag‐tagged plasmids (right‐lower panel). (b) The quantified result of Elk‐1 SUMOylation (n = 5 different animals for each group). * P < 0.05 for Elk‐1K229R versus Elk‐1WT group and ** P < 0.05 for Elk‐1 3KR versus Elk‐1WT group and for Elk‐1WT + SUMO1 mutant protein versus Elk‐1WT group. (c) Control siRNA or PIAS1 siRNA was transfected to the rat CA1 area, and endogenous Elk‐1 SUMOylation was determined 48 hr later as described above but without the addition of the recombinant PIAS1 protein. (d) The quantified result of Elk‐1 SUMOylation (n = 5 different animals for each group). # P < 0.05. (e) Western blot of PIAS1 expression and the quantified result (n = 5 different animals for each group). # P < 0.05. (f) Immunohistochemistry showing PIAS1 (green) and Elk‐1 (red) are both present in the nucleus of the same neurons in the CA1 area of the rat brain (n = 3 different animals for each group). The lower panel is the magnification of the selected area from the upper panel. Scale bar is 25 μm for the upper panel and 10 μm for the lower panel. Data are mean ± SEM
