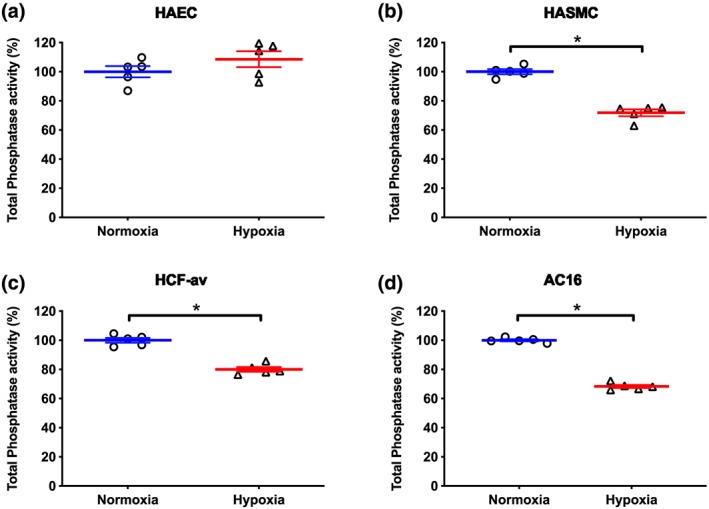
Figure 2.

Effect of hypoxia (1% O2, 24 hr) on total protein phosphatase activity in (a) HAEC, (b) HASMC, (c) HCF‐av, and (d) AC16 cells. Data are presented as a percentage of total phosphatase activity (means ± SEM; n = 5) under normoxic conditions and were analysed using an unpaired Student t‐test. *P < 0.05, significantly different as indicated
