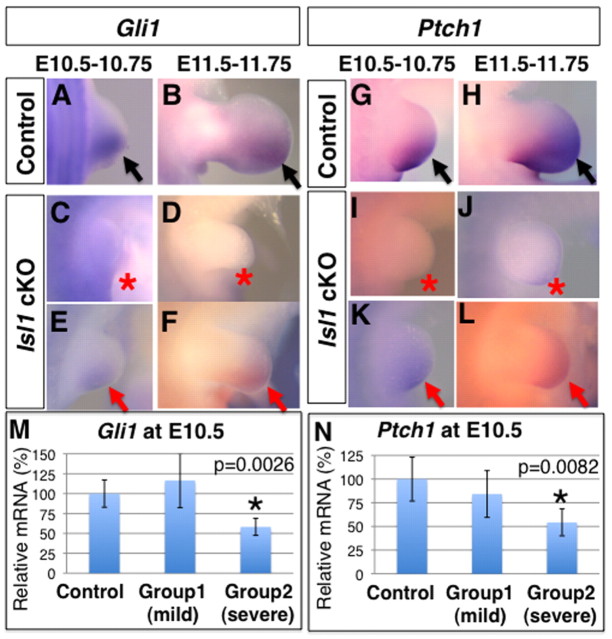
Fig. 3.
Reduction of SHH signaling in Hoxb6Cre; Isl1 cKO hindlimb buds. (A-L) Lateral views of Gli1 (A-F) and Ptch1 (G-L) expression in control (A,B,G,H) and Hoxb6Cre; Isl1 cKO (C-F,I-L) hindlimb buds. Black arrowheads indicate normal expression, red arrowheads and asterisks indicate reduced and no expression, respectively. (A-F) Gli1 expression in the posterior mesenchyme at E10.5-10.75 (A) and 11.5-11.75 (B) was either not detected (C,D) or significantly downregulated (E,F) in Isl1 cKO hindlimbs. (G-L). Ptch1 expression in the posterior mesenchyme at E10.5-10.75 (G) and 11.5-11.75 (H) was either not detected (I,J) or significantly downregulated (K,L) in Isl1 cKO hindlimbs. (M,N) qRT-PCR analysis of Gli1 (M) and Ptch1 (N) transcript levels in hindlimb buds at E10.5. The relative transcript levels in two groups of mutants (n=6 in group1, n=4 in group2) in comparison with controls (n=6) are shown as average ±s.d. Asterisks indicate statistically significant changes.

