
Figure 2.
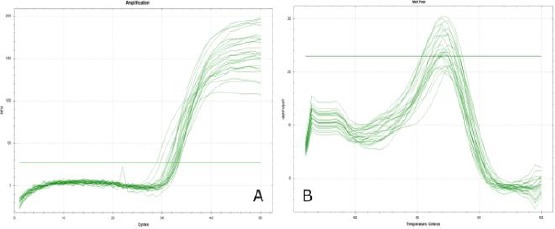
Graph of QPCR primary optimization results of PGE2 gene; A) Graph of amplification curve results on qPCR; B) Homogeneous melting peak graphs from the results of qPCR
Official websites use .gov
A
.gov website belongs to an official
government organization in the United States.
Secure .gov websites use HTTPS
A lock (
) or https:// means you've safely
connected to the .gov website. Share sensitive
information only on official, secure websites.
Graph of QPCR primary optimization results of PGE2 gene; A) Graph of amplification curve results on qPCR; B) Homogeneous melting peak graphs from the results of qPCR