
Fig. 2.
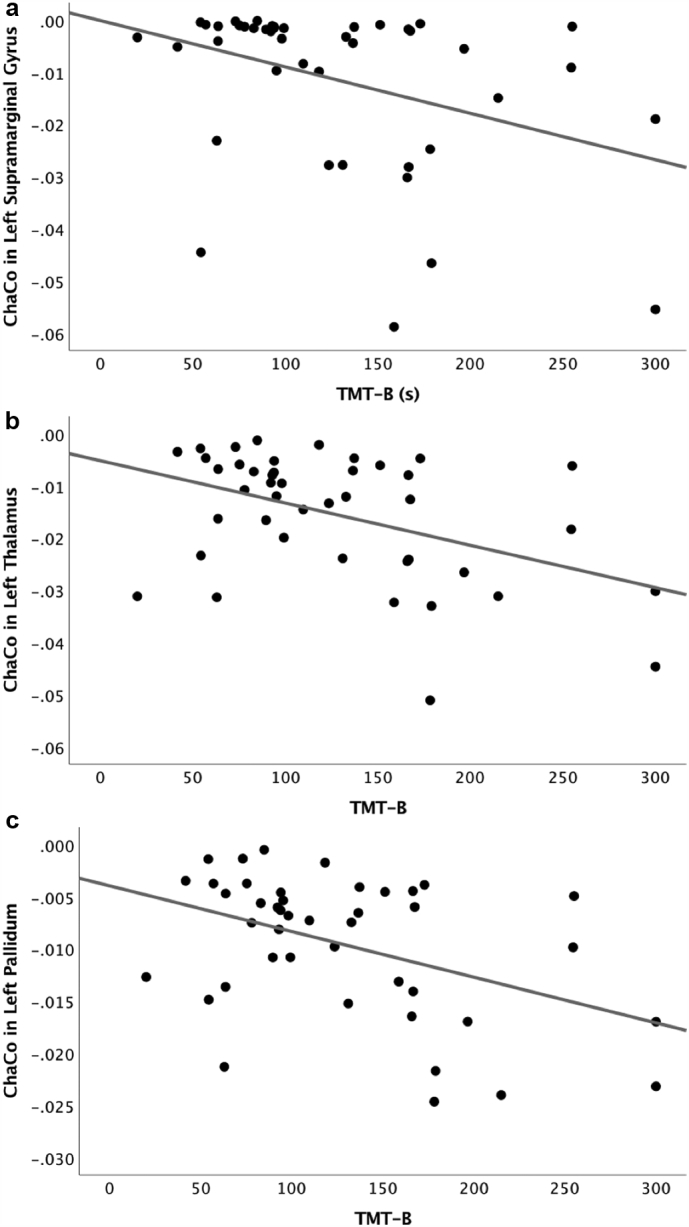
Scatterplots depicting the relationship between Trail Making Test-B (TMT-B) performance in seconds and change in connectivity (ChaCo) in the (a) left supramarginal gyrus, (b) left thalamus, and (c) left pallidum.
Official websites use .gov
A
.gov website belongs to an official
government organization in the United States.
Secure .gov websites use HTTPS
A lock (
) or https:// means you've safely
connected to the .gov website. Share sensitive
information only on official, secure websites.
Scatterplots depicting the relationship between Trail Making Test-B (TMT-B) performance in seconds and change in connectivity (ChaCo) in the (a) left supramarginal gyrus, (b) left thalamus, and (c) left pallidum.