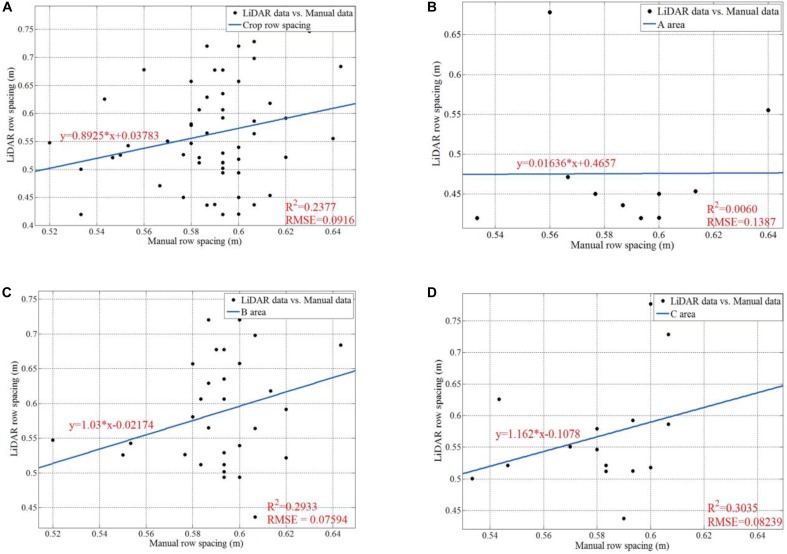
FIGURE 18.
Data analysis for manually sampled and calculated results of row spacing. (A) Is the regression line, the R square, and the RMSE for all the 57 row spacing values; (B) is the regression line, the R square, and the RMSE for the row spacing values in Area A; (C) is the regression line, the R square, and the RMSE for the row spacing values in Area B; (D) is the regression line, the R square, and the RMSE for the row spacing values in Area C.

