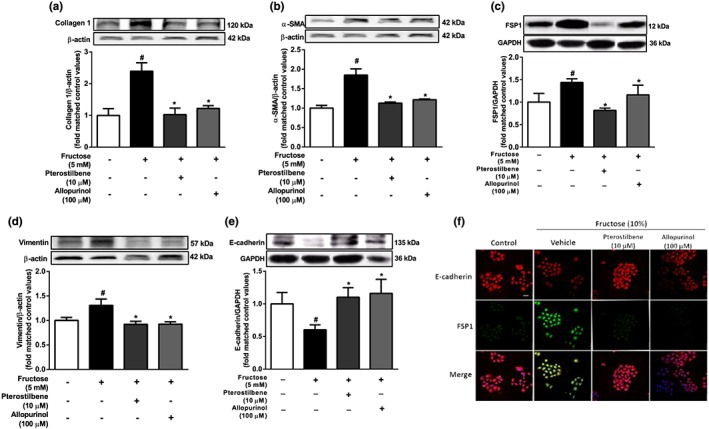
Figure 4.

Effects of pterostilbene on hepatocyte EMT induced by fructose in BRL‐3A cells. The cells were cultured without or with 5 mM fructose for 72 hr. (a–e) Protein levels of collagen 1, α‐SMA, FSP1, vimentin, and E‐cadherin after 72 hr‐treatment with different doses of pterostilbene or allopurinol. (f) Representative images of immunofluorescence staining for E‐cadherin (red) and FSP1 (green) after 72 hr‐treatment with 10 μM pterostilbene or 100 μM allopurinol (scale bar 50 μm). Data shown are means ± SEM from 6 independent experiments. Data for all bar graphs are expressed as fold change in gene or protein band values matched control values # P < 0.05, significantly different from control group and *P < 0.05, significantly different from fructose vehicle group
