Fig. 1.
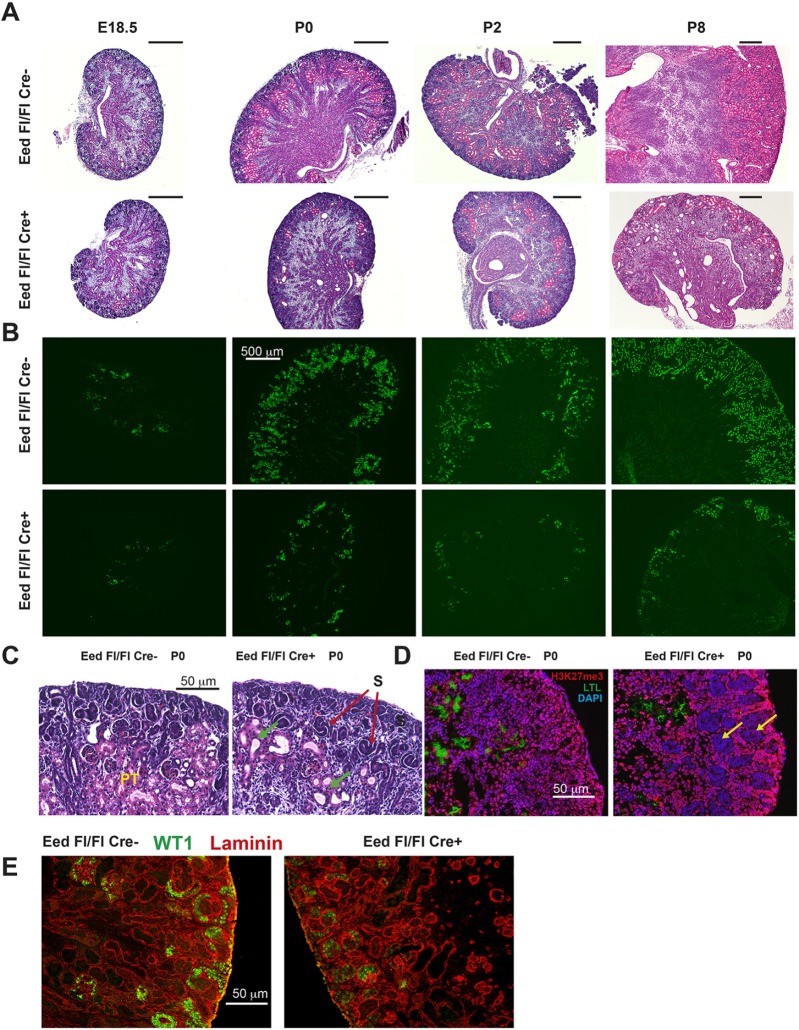
Histology and characterization of Eed mutant kidneys. (A) Hematoxylin and Eosin stains of E18.5, P0, P2 and P8 kidneys as indicated at the top of each column. Genotypes: top row, Eed fl/fl; bottom row, Six2-TGC, Eed fl/fl. (B) LTL lectin staining at equivalent time points as in (A). Top and bottom row genotypes as in (A). (C) Higher-power histology of P0 kidneys showing S-shaped tubules in Eed mutants (red arrows) and proximal tubules (PT) abundant in controls and largely absent in Eed mutants. Dysgenic tubules are present in Eed mutants (green arrows). (D) H3K27me3 staining (pink) showing areas of absent staining in Eed mutants (yellow arrows). (E) WT1 (green) and laminin (red) immunostaining of P0 kidneys. All images are representative of at least three kidneys analyzed. Scale bars in A: 500 µm.

