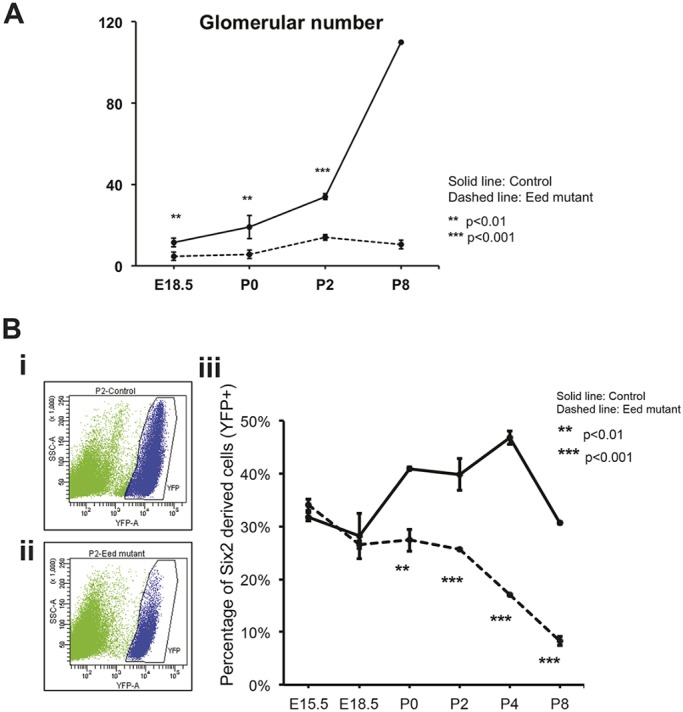
Fig. 2.

Quantification of kidney growth. (A) Glomerular counts at E18.5, P0, P2 and P8 kidneys. See Materials and Methods for details of counting. Data are presented as mean±s.d. **P<0.05, ***P<0.01, Student's t-test. (B) FACS analysis of cells derived from P2 (i) Six2-TGC; Eed fl/+ R26R-EYFP+ kidneys; (ii) Six2-TGC; Eed fl/fl R26R-EYFP+ kidneys. (iii) Cell counts from time points indicated on the x-axis are plotted as YFP-expressing cells as a percentage of the total cells sorted. The YFP+ cells were designated as shown in blue for the P2 time point in (i,ii). P-values in A and Biii refer to differences between controls and mutants at the specific time points. At least four kidneys per time point/genotype were used. Data are presented as mean±s.d. **P<0.01, ***P<0.001, Student's t-test.
